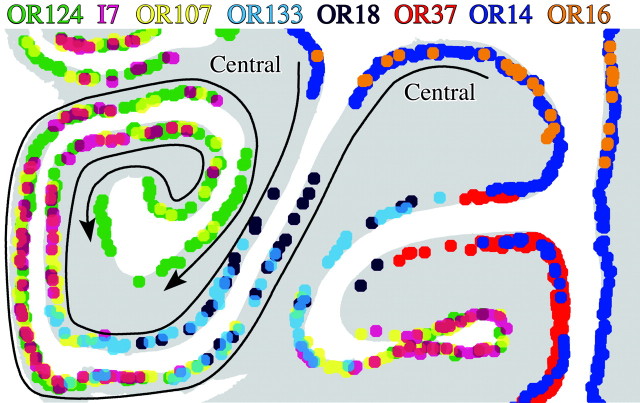
Figure 3.
Expanded view of the lateral part of the left OE from the middle level shown in Figure 2, in which the labeling from all eight probes is mapped onto a single copy of the schematic section. Each dot marks the position of an OR-positive OSN, and each color represents an OR subtype as indicated. The arrows designate the progression of OR labeling as one proceeds from central to peripheral along the opposing epithelial surfaces. The progression is also indicated by the order of listing the OR probes across the top from central (at the right) toward peripheral (at the left). Each of the eight ORs in the panel has a unique expression pattern in this and other portions of the adult rat OE.

