
Figure 4.
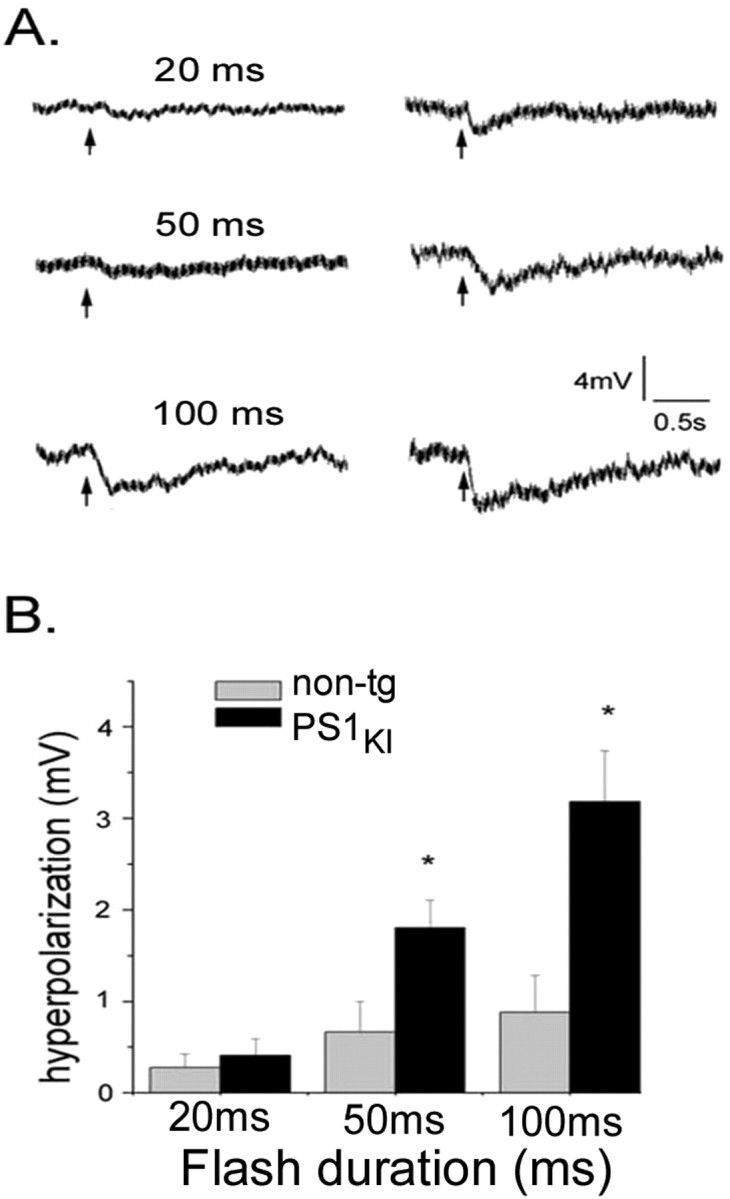
IP3-evoked hyperpolarizing membrane potential responses are enhanced in PS1KI neurons. A, Representative traces of membrane potential in a non-tg neuron (left column) and a PS1KI neuron (right) in response to photolysis flashes with durations as indicated in milliseconds. B, Bar graph showing average IP3-evoked hyperpolarizations evoked by these photolysis flashes, pooled from all non-tg (gray bars; n = 15-17) and PS1KI (black bars; n = 11-15) neurons.