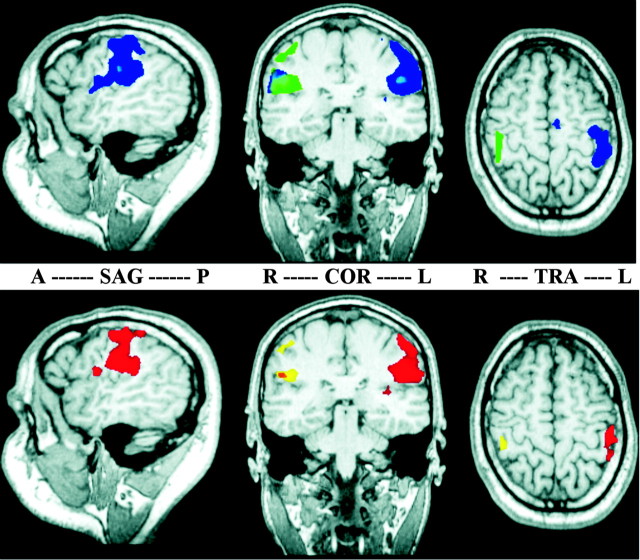
Figure 1.
Cortical activation patterns after stimulation of the right and left IF before (top) and after (bottom) coactivation, as revealed by random-effects group statistics. In the sagittal slices (SAG), anterior is left (A) and posterior is right (P). In the coronal (COR) and transversal (TRA) slices, radiological convention is used (R, right hemisphere; L, left hemisphere). Cortical representations of the right IF are shown in blue (pre) and red (post), representations of the left IF in green (pre) and yellow (post). Note the bilateral activations in SII that are mostly overlapping for both fingers, as indicated by the mixed color patches (pre, light blue; post, orange). No bilateral activation can be seen in SI.

