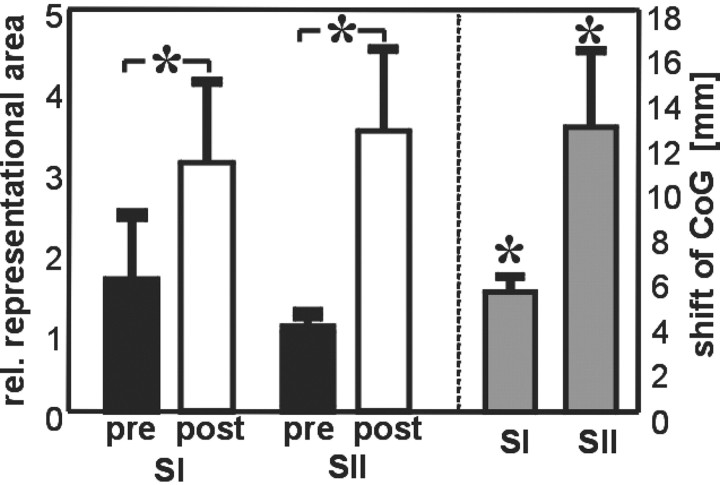
Figure 2.
Changes in representational area and shift of CoG (means ± SEM). On the left, the relative number of voxels (left vs right hemisphere) in SI and SII contralateral to the right IF before (pre, black columns) and after (post, white columns) coactivation are shown. In both areas, the relative size of the representation of the test finger is significantly increased. The parallel shift of the CoG in SI and SII is shown on the right (gray bars). *p < 0.05.

