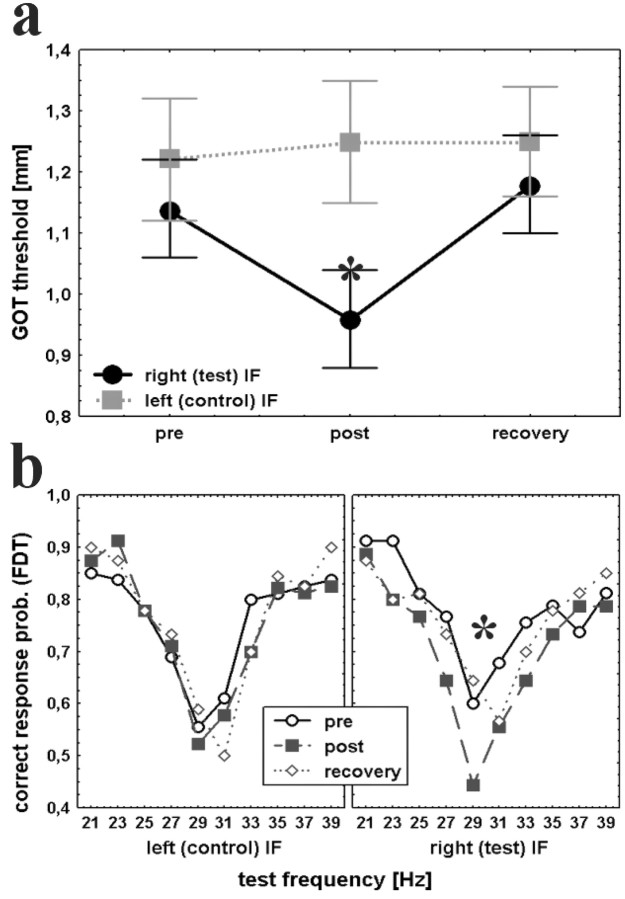
Figure 3.
Coactivation-induced changes in tactile discrimination performance. a, Thresholds in the GOT before (pre) and after (post) tactile coactivation on the right IF and after a 24 hr recovery period (recovery) are shown for the control (squares) and the test (circles) finger (means ± SEM). Reduction in thresholds indicates improved performance in the post condition for the test but not the control finger. b, Probability of correct responses in the FDT before (circles) and after (squares) coactivation and after recovery (diamonds) for the test (right) and the control (left) finger. Reduction in correct response probability for the test but not the control finger reveals a decline in frequency discrimination performance. *p < 0.05.

