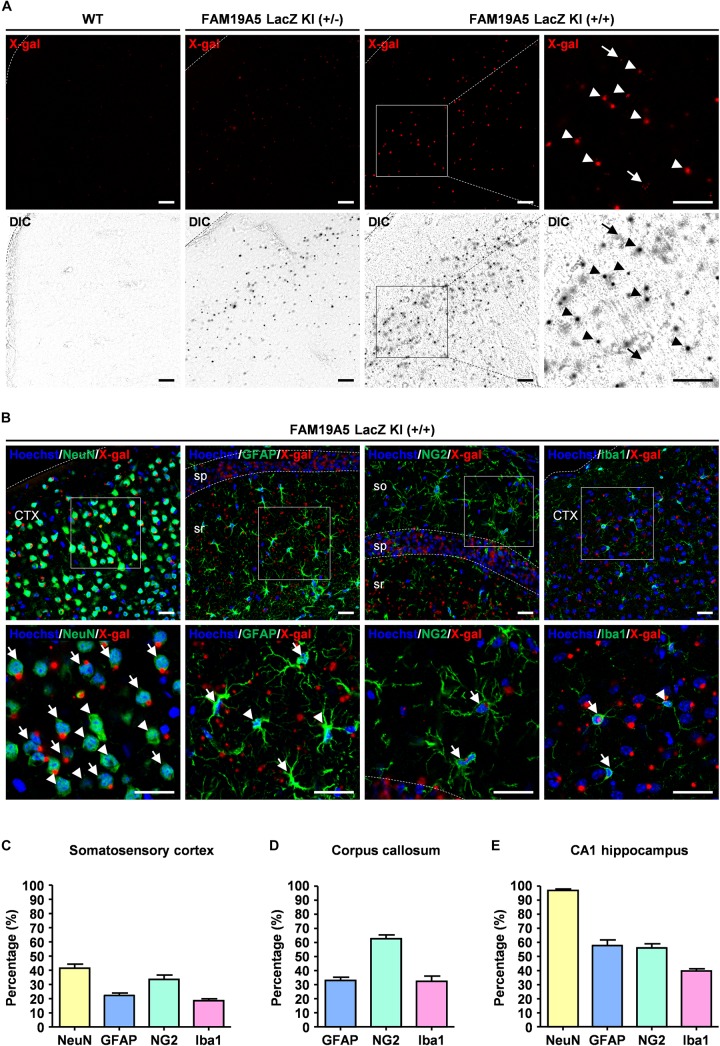
FIGURE 3.
Quantification of X-gal+ neuronal and glial cells via direct confocal acquisition of X-gal fluorescence. (A) Confocal acquisition of fluorescence from X-gal precipitates in the wild-type (WT) and FAM19A5-LacZ knock-in (KI) mouse brains. Fluorescence signals were stronger in FAM19A5-LacZ KI homozygote (+/+) mice than in heterozygote (+/−) mice. However, these fluorescence signals were not observed in the WT mouse brains. Differential interference contrast (DIC) images were used to determine whether the florescence signal originated from X-gal precipitates. Arrow heads indicate florescence from X-gal precipitates but arrows represent auto-fluorescence signals that are not driven from X-gal precipitates. (B) X-gal staining combined with immunofluorescence staining for cell type-specific markers of the adult FAM19A5-LacZ KI (+/+) mouse brain. Brain sections incubated for 24 h in X-gal solution were immunostained for cell markers, including NeuN, GFAP, NG2, and Iba1. X-gal fluorescence signals were observed in subpopulations of neurons (NeuN), astrocytes (GFAP), oligodendrocyte precursor cells (NG2), and microglia (Iba1). Arrows and arrow heads represent cell-type marker+ cells with and without X-gal fluorescence signal, respectively. (C–E) Quantification of X-gal+ cells in the somatosensory cortex (C), medial corpus callosum (D), and CA1 region of the hippocampus (E). Number of X-gal+ cells out of cell-type marker+ cells were counted based on both fluorescence and DIC images. Data were presented as the means ± standard errors of the mean (n = 5). CTX, cerebral cortex; so, stratum oriens of the hippocampus; sp. pyramidal cell layer of the hippocampus; sr, stratum radiatum of the hippocampus. Scale bar represents 50 μm.

