
Figure 2.
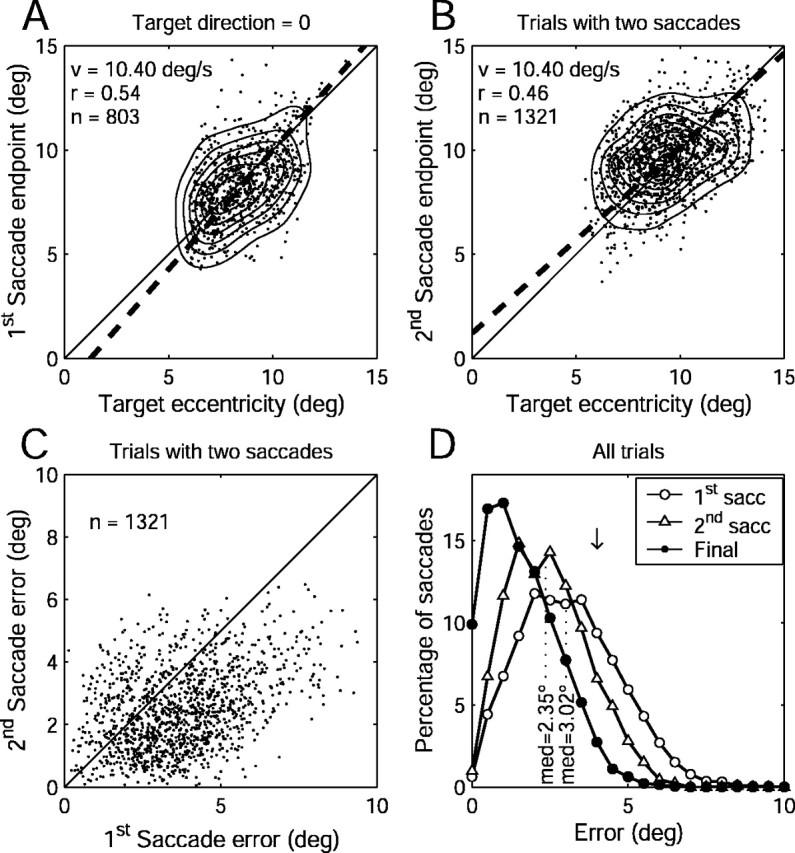
Behavioral analysis of saccades to invisible moving targets. A, Eye position eccentricity after the first saccade versus extrapolated target eccentricity for a single target direction (0, rightward). The dots are data for individual trials. Thin curves are iso-density contours. The legend shows the correlation coefficient (r), target speed (v), and number of saccades (n). The dashed line is linear regression (PCA method). The thin solid line is x = y. B, Eye position versus target position at the end of the second saccade on trials with two or more saccades during the occlusion interval. The conventions are the same as in A. C, Error (eye position regarding target position) after the first and second saccades for trials with at least two saccades. The legend indicates the number of trials (n). The thin line is x = y. D, Distribution of errors (eye position relative to invisible target position) after the first saccade (open circles), second saccade (open triangles), or just before the reappearance of the target (Final). The dotted lines indicate the median error for the first and second saccades. The downward arrow indicates the size of the fixation window (4°).