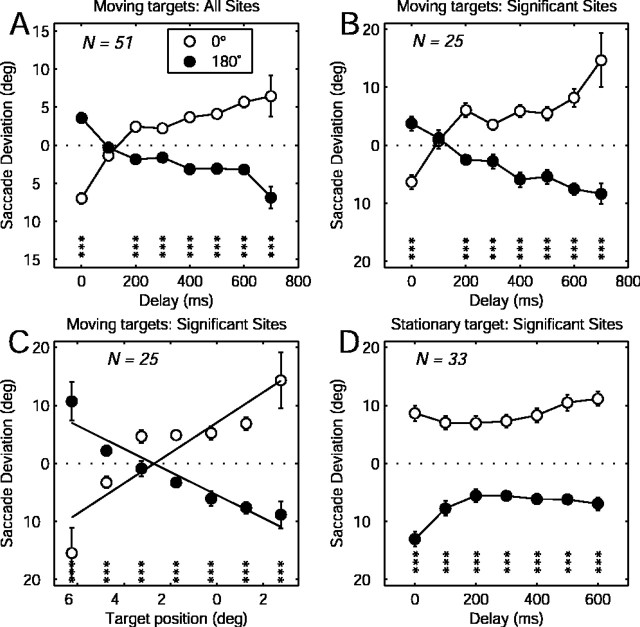
Figure 4.
Directional bias of evoked saccade as a function of stimulation onset time. A, All sites tested with orthogonal target motion. B, Sites with a significant (p < 0.05) effect of target direction. The error bars are ± 1 SEM. The asterisks indicate the t test significance level (*p < 0.05; **p < 0.01; ***p < 0.001). C, Relationship between evoked saccade deviation and invisible target position. The lines indicate best-fitting simple linear regressions. D, Stimulation during the delay interval of a memory-guided saccade task. The conventions are the same as in A and B. Note that the y-axis scale in A is different from the other panels.

