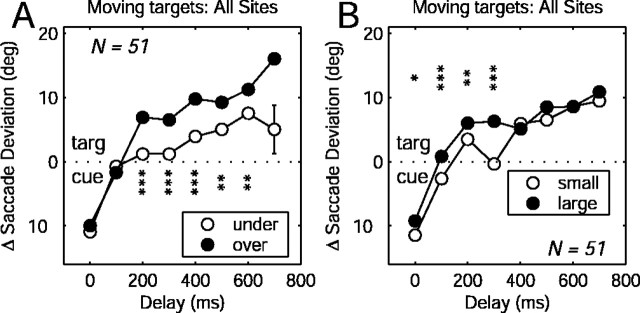
Figure 5.
Dependence of evoked saccade bias on behavioral performance. A, Total saccade deviation as a function of delay duration for undershoot trials (open circles) and overshoot trials (filled circles). B, Saccade deviation for trials in which the voluntary saccade was smaller (open circles) or larger (filled circles) than the median. The error bars are ± 1 SEM (most error bars were smaller than the plotted symbols). The asterisks indicate the t test significance level (*p < 0.05; **p < 0.01; ***p < 0.001).

