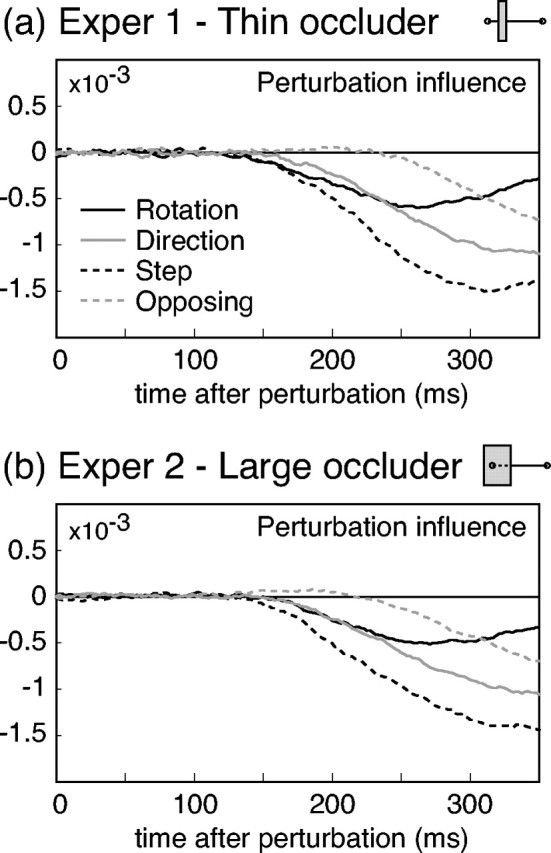
Figure 4.

Perturbation effects. a, Results for experiment 1, in which the occluder was thin and the initial movement was visible. The four lines plot the perturbation in fluence functions for each of the four perturbation types. The raw weights derived from the regression analysis (see Materials and Methods) were smoothed by a causal exponential filter with time constant 25 msec and then averaged across subjects (n = 5). b, Results for experiment 2, in which the occluder was large and covered the entire initial movement. The plots show smoothed perturbation influence functions, averaged across subjects (n = 8), as in the previous plot.
