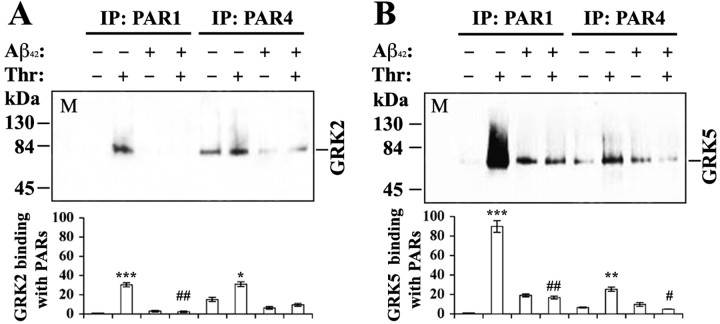
Figure 3.
Effects of subthreshold Aβ pretreatment on the binding of GRKs to PARs. N9 cells were pretreated with Aβ1-42 (500 nm) for 5 min and then challenged with thrombin (Thr, 100 nm) for 30 sec as in Materials and Methods. Cells were immediately lysed for IP and WB analysis. The bar graphs represent averages of three repeats of the same experiments as analyzed by densitometry. For both A (probed for GRK2) and B (probed for GRK5), lane M is the marker; the others are as indicated. The number on both y-axes indicates fold changes of the mean densities as standardized against the untreated control of IP with PAR1 for each blot. Separate two-way ANOVA followed by post hoc comparisons of the means (Scheffe's test) were made. #p < 0.01 and ##p < 0.001 indicate the significance of the groups in the presence of Aβ pretreatment compared with the groups in the absence of Aβ pretreatment. *p < 0.05, **p < 0.01, and ***p < 0.001 are the levels of significance over the untreated controls in each corresponding measurement.

