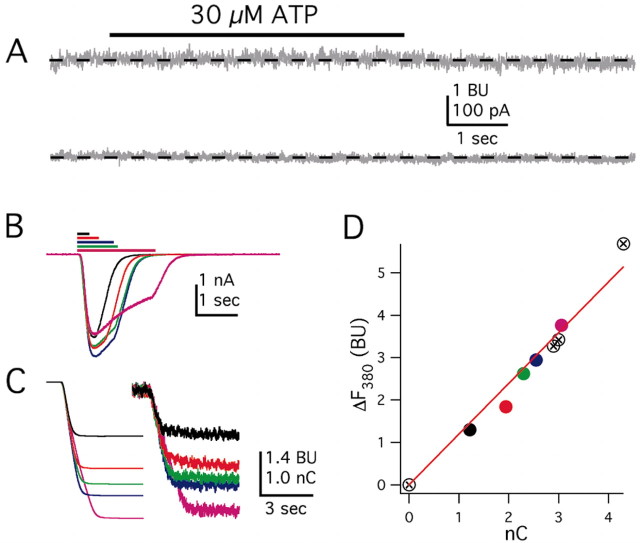
Figure 3.
Controls and calibrations for measurements of Pf% at P2X channels. A, Lack of effect of 30 μm ATP on membrane current (bottom trace) and F380 (top trace) in a mock-transfected HEK293 cell. B–D, Representative traces for an HEK293 cell expressing P2X2 channels and activated with 10 μm ATP for increasing durations, as indicated by the length of the bars in B. B shows the current traces (for clarity, we show only 5 of the 9 traces), and C shows the corresponding integrated currents (QT, left traces) and changes in fluorescence (ΔF380, right traces). D shows a plot of ΔF380 versus QT. The data fall on a straight line, as expected if P2X channels are the only source of Ca2+. The traces and data are colored coded in B–D so that any individual response can be compared across all graphs. In D, there are four additional data points that, for the sake of simplicity, are not illustrated in B and C.

