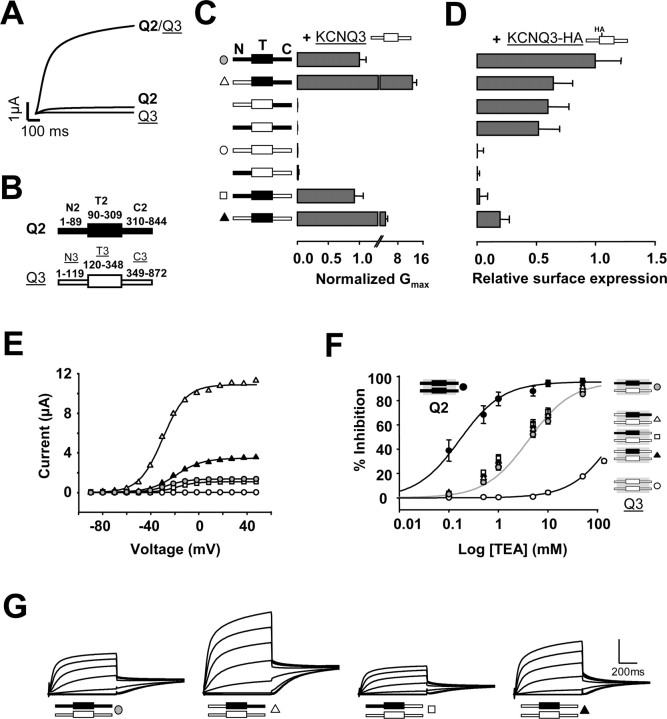
Figure 1.
The transmembrane region is critical for Q2/Q3 potentiation. A, Current records evoked by 800 msec voltage steps to +50 mV from a holding potential of -50 mV of Q2, Q3, and Q2/Q3 channels. B, Schematic representation of the subunits. The figure indicates the amino acid boundaries for the three portions: N terminus (N), C terminus (C), and transmembrane region (T). The transmembrane region is depicted as a box; segments from Q2 are shaded in black, and those from Q3 are shaded in white. C, Left, Schematic representation of chimeric Q2/Q3 constructs. The averaged normalized maximal conductance obtained after fitting a Boltzmann distribution to g-V relationships (E) from tail currents measured at -20 mV (G) of the constructs indicated were coexpressed with Q3 in a 1:1 ratio (n ≥ 10 from 2 or more batches of oocytes). D, Normalized surface expression of HA-tagged Q3 subunits after coexpression with the constructs indicated on the left (n ≥ 15). Heteromerization of the C terminus increased the number of Q3 subunits at the membrane. The differences in the mean surface expression of the first four groups were not statistically significant. E, Representative conductance-voltage relationship of tail currents measured in 800 msec current traces at -20 mV for Q2/Q3 heteromers, Q3 homomers, and selected chimeric constructs coexpressed with Q3. Boltzmann distributions were fitted to the data (continuous lines). The averaged Boltzmann parameters were: Q2+Q3 (gray circles): V1/2 = -28.68 ± 0.53 mV, slope = 10.4 ± 0.15 mV (n = 118); N3T2C2+Q3 (open triangles): V1/2 =-32.79 ± 2.26 mV, slope = 10.3 ± 0.63 mV (n = 11); N2T2C3+Q3 (open squares): V1/2 = -22.02 ± 1.07 mV, slope = 11.5 ± 0.69 mV (n = 11); N3T2C3+Q3 (filled triangles): V1/2 =-19.80 ± 1.50 mV, slope = 12.6 ± 0.72 mV (n = 9). F, Dose-response curves for TEA blockage of Q2 (filled circles; n = 6), Q3 (empty circles; n = 4), Q2/Q3 (gray circles; n = 15). The solid lines are the result of fitting the Hill equation to the data with an IC50 value of ∼0.16 mm for Q2, ∼4.1 mm for Q2+Q3, and >200 mm for Q3. The data for Q3 was obtained with the A315T mutant to clearly evoke measurable currents (see Fig. 2C). G, Representative collection of 800 msec tail currents recorded at -20 mV evoked after 800 msec voltage steps from -120 to +50 mV evoked in oocytes held at -50 mV. The vertical bar represents 2.0 μA, except for N3T2C2+Q3 (open triangle), where it represents 6.0 μA.

