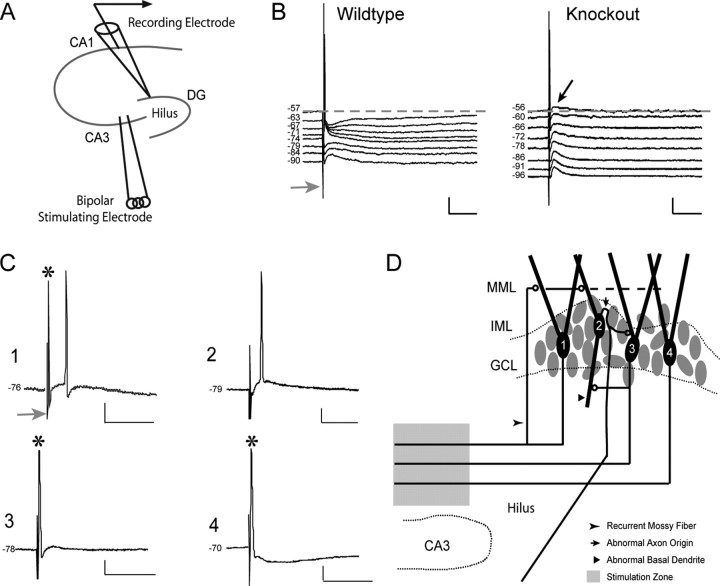
Figure 5.
A, Schematic shows the stimulation (in the stratum lucidum) and recording (in GC layer) configuration used in these experiments. B, Families of evoked responses, from a wild-type GC and a knock-out GC, illustrate commonly seen response patterns for these groups (19 wild-type GCs; 25 p35-/- GCs). DC current injection was used to vary the membrane potential of the GC during its response to MF stimulation in the CA3 stratum lucidum. Inversion of a short-latency component of the response, after the initial antidromic spike, was taken to reflect a GABAA-mediated IPSP. This IPSP was absent (black arrow) in a significant proportion of p35-/- cells. Dashed lines represent the resting membrane potential of the cells; gray arrows identify the time of stimulation. Calibration: 5 mV (vertical), 25 msec (horizontal). C, Representative responses from dentate granule cells from knock-out slices, illustrating the variable patterns of evoked responses. D, Hypothetical schematic suggesting potential circuitry configurations that may explain the variability illustrated in C. 1, A cell with both an antidromic and an orthodromic action potential (6 of 25 cells); 2, a cell with no antidromic response but an orthodromically driven action potential (11 of 25 cells); 3, a cell with an antidromic response but no subsequent orthodromic response component (3 of 25 cells); 4, a cell with an antidromic action potential, followed by a relatively normal IPSP (5 of 25 cells). Calibration: 5 mV (vertical), 25 msec (horizontal).

