
Figure 1.
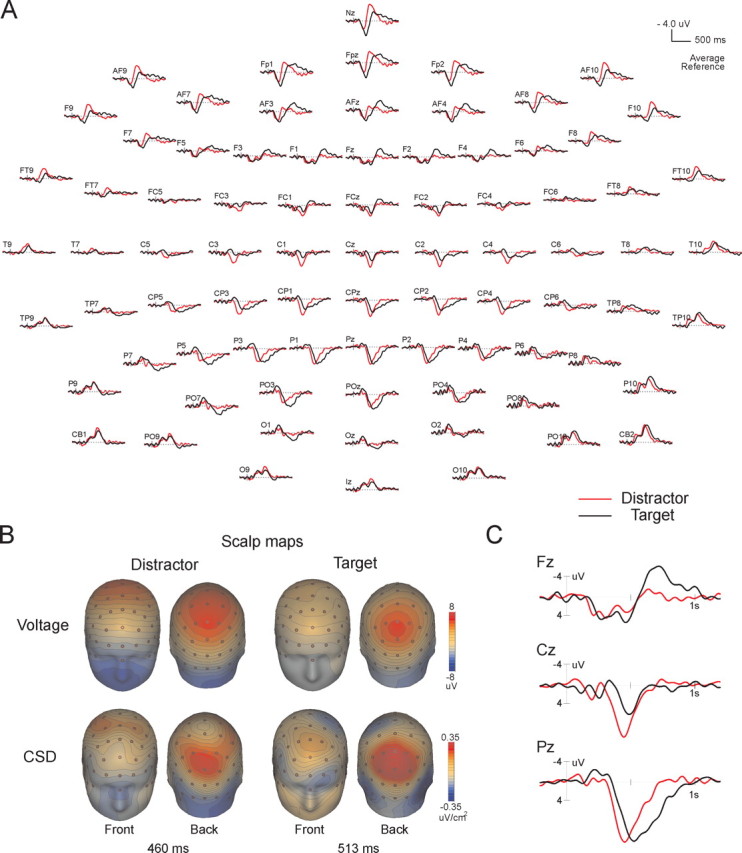
ERP responses in target and distractor condition. A, Grand average difference ERP waveforms to distractor (red line) and target (black line) stimuli at 81 standard electrodes sites exported from 63 recorded electrodes. B, Spline-interpolated topographical maps of scalp voltage and CSD calculated at the respective peak latencies in the target and distractor condition. C, Enlarged view of key midline electrodes from A.