
Figure 9.
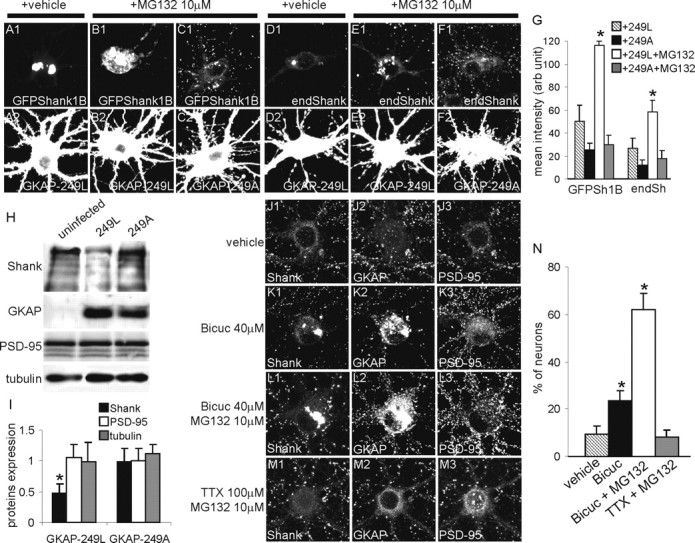
GKAP-249L induces partial degradation of GFPShank1B and endogenous Shank in neurons by means of proteasome degradation. A-F, DIV10 neurons were transfected with GFPShank1B plus GKAP-249L (A, B), GFPShank1B plus GKAP-249A (C), GKAP-249L alone (D, E), or GKAP-249A alone (F) and stained on DIV15 for GFP (A-C1), Shank (D-F1), and GKAP (A-F2). To test whether proteasomes are involved in this process, we treated the neurons with 10 μm of the MG132 proteasome inhibitor for 12 hr. G, The graph indicates the mean fluorescence intensity (arbitrary units ± SE) of the cell bodies of MG132-treated or untreated neurons. At least 10 neurons were measured at each experimental point; *p < 0.01 versus GKAP-249L without MG132. H, Neurons were infected at DIV5 with a lentivirus vector expressing GKAP-249L or GKAP-249A and lysated on DIV14. The expression of endogenous Shank, PSD-95, and tubulin was measured by Western blotting and quantified as shown in I. I, The graph indicates the mean value ± SE of the band intensity ratios between infected and uninfected neurons. The values were obtained from three independent experiments; *p < 0.05 versus GKAP249A. J-M, Bicuculline stimulation induces the formation of endogenous Shank and GKAP aggregates in cell bodies. The neurons were treated for 24 hr as indicated on the left of each panel and then stained for endogenous Shank (J1-M1), GKAP (J2-M2), and PSD-95 (J3-M3). Intracellular aggregates formed by endogenous Shank and GKAP (but not PSD-95) are visible in the neurons treated with bicuculline or bicuculline plus MG132. N, The graph indicates the mean ± SE percentage of neurons with intracellular aggregates. The data were obtained by counting at least 100 neurons from six coverslips obtained from three independent experiments for each treatment; *p < 0.01 versus vehicle and TTX plus MG132.