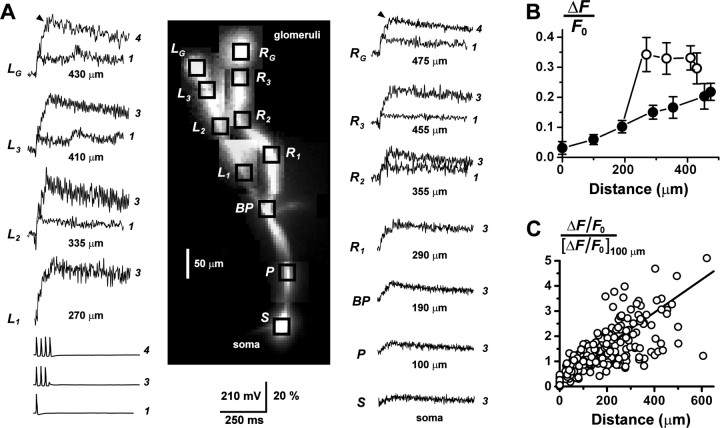
Figure 2.
Calcium signaling in multiple branches of the AOB primary dendrites. A, During whole-cell recording, two branches of the primary dendrite of an AOB mitral cell were traced to their terminal glomerular arborizations (tufts) by fluorescence imaging. Trains of three action potentials were evoked by injection of series of 3 msec, 1 nA pulses into the soma. Prominent fluorescence transients ΔF/F0 were recorded from the soma (S), proximal dendrite (P), and both left (L1-L3) and right (R1-R3) branches of the distal dendrite. At the glomerular tufts (LG and RG; 430 and 475 μm, respectively), the cell fired a fourth action potential, the timing of which is indicated by the black arrowheads just before the peaks of the traces. Overlaid are the responses to the firing of a single-action potential, recorded from the tufts and distal dendrites (> 300 μm). A single spike could evoke a large, fast Ca2+ signal in the distal compartments of the cell, showing that the large glomerular responses to spike trains did not require temporal summation of series of passively conducted voltage transients. The different amplitudes of the left and right branches may be attributable to an asymmetry in dendritic diameter. Vertical scale bar, membrane potential Vm (millivolts) and ΔF/F0 (percentage). The number of action potentials fired is indicated to the right of the traces. Dendritic branch traces were low-pass filtered (200 Hz) to reduce high-frequency noise. B, Plot of the amplitude of ΔF/F0 versus distance from the soma for the cell in A. Amplitudes were measured after discharge of three action potentials (at black arrow in the tufts). ○, Left dendrite; •, trunk and right dendrite. C, Plot summarizing the increasing trend of ΔF/F0 with increasing distance from the soma, for primary dendrites from n = 47 cells. For each cell, the ΔF/F0 profile was normalized to its value at 100 μm, and the plots from all cells were pooled. The somatic amplitude was not used here for normalization because of its greater variance. The number of action potentials that generated these responses was variable (1, 3, or 4 spikes). The approximately linear relationship between fluorescence increment and spike number for NAP < 4 (see Fig. 1C) allowed us to combine data sets with varying spike number without distorting the normalized profiles. The fitted line represents the average linear regression for the sample of all cells.

