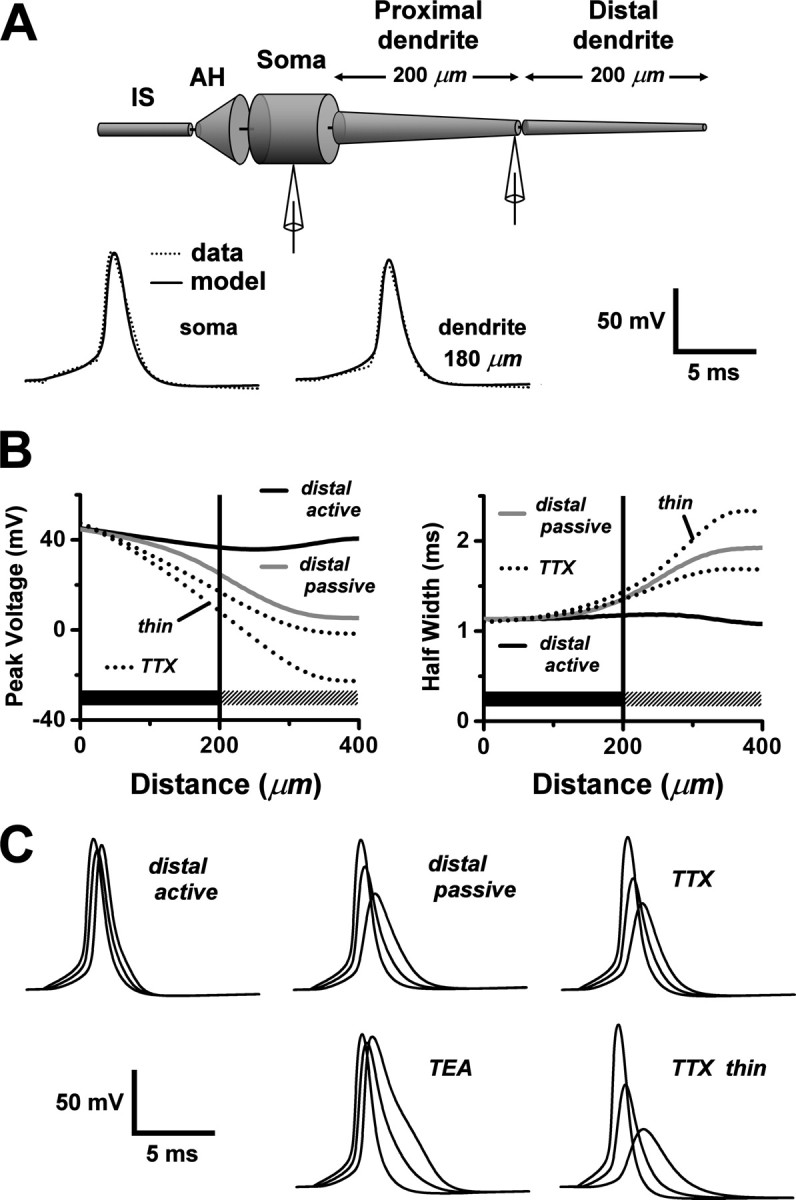
Figure 6.

Modeling action potential backpropagation in the AOB primary dendrite. A, Top, A schematic illustration of our compartmental model of an AOB mitral cell with a single tapered primary dendrite. The distal half of the dendrite was represented as a separate section, in which the density of Na+ and K+ channels could be independently set to zero to explore the consequences of passive backpropagation. AH, Axon hillock; IS, axon initial segments. Bottom, Action potential waveforms computed from the model (solid curves) were fit to action potentials obtained from a paired soma- dendritic whole-cell recording (dotted curves; dendritic recording at 180 μm). Pipette symbols in top diagram show approximate recording locations. B, Plots, as a function of distance from the soma, of model calculations of the peak voltages (left) and half-widths (right) of voltage transients associated with action potential backpropagation under the following different conditions: (1) solid black curves: the control condition, with active backpropagation supported by Na+ and K+ channels uniformly distributed throughout the full length of the dendrite; (2) solid gray curves: passive distal dendrite, with Na+ and K+ channels retained in the proximal dendritic section (dark horizontal bars), but deleted from the distal dendritic section (> 200 μm; hatched horizontal bars); (3) unlabeled dotted curves: simulation of the TTX experiment, with Na+ channels deleted everywhere, and the somatic action potential waveform of the control condition (1) applied by single-electrode voltage clamp at the soma (electrode series resistance, 10 MΩ); and (4) dotted curves labeled “thin”: same as previous condition, but with a thin tapered dendrite (d0 = 2 μm; λT = 150 μm). C, Computed voltage transients during action potential backpropagation. Each set of three waveforms shows the voltage at the soma, middle of the dendrite (200 μm), and end of the dendrite (400 μm) (backpropagation time lag from left to right). Plots labeled “distal active,” “distal passive,” “TTX,” and “TTX thin” correspond, respectively, to conditions 1-4 in Figure 7B. In the plot labeled “TEA,” K+ channels were deleted everywhere, Na+ channels were retained as in the control condition (1), and a control somatic action potential waveform was applied by a single-electrode voltage clamp at the soma.
