
Figure 2.
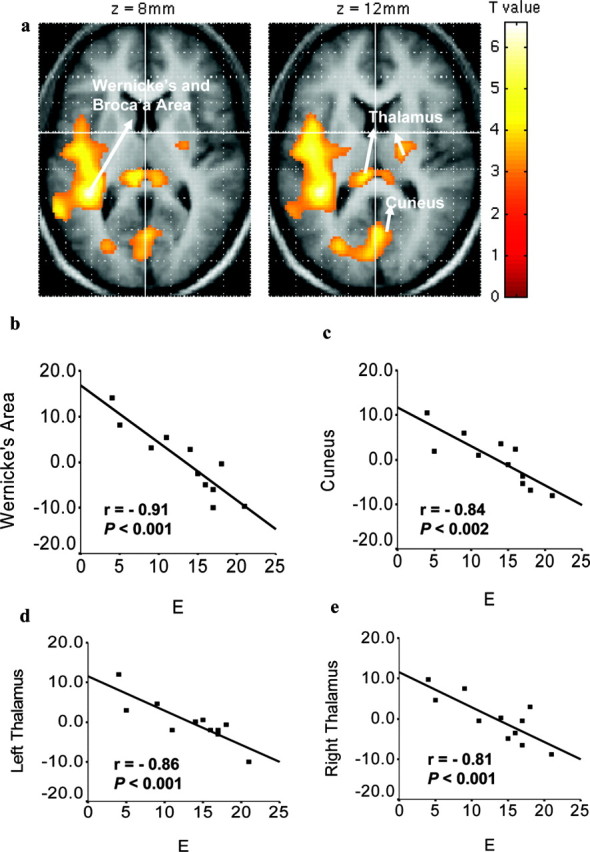
Localized personality correlates in the globally normalized resting signal intensity related to E. a, Regression map in SPM-derived T values thresholded at p < 0.005 (uncorrected) and superimposed on the average structural image. Color bar shows the strength of the correlation with E. Axial view with associated z coordinates is shown; left hemisphere is shown on the left. Localized resting fMRI signal in relation to intersubject local mean intensity (y-axis) in Wernicke's area (b), cuneus (c), and left (d) and right (e) thalamus as a function of E (x-axis). Graphs show SPSS-derived r values and probabilities.