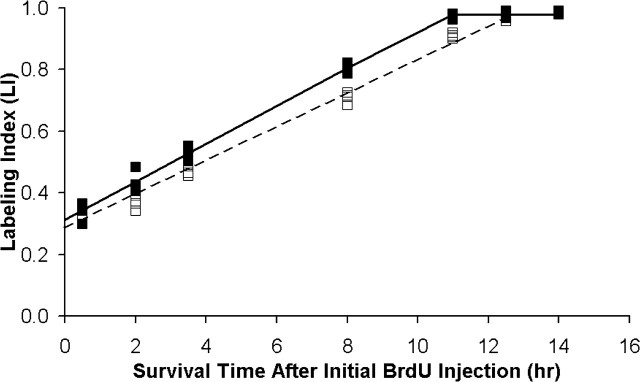
Figure 2.
Plots of BrdU LIs determined by cumulative labeling with BrdU in nestin/IGF-I Tg and control embryos on E14. The cumulative injection experiments were initiated at 9:00 A.M., with the final survival time point collected 14.0 hr later. LI was determined for the VZ, which was seven bins in height for both Tg and control animals. For each group, a least-squares curve was fit to all data points from each survival time in the analysis. The plots illustrate the linear advance of LI toward maximum levels in Tg (filled squares, solid line) and control (open squares, dashed line) embryos as the number of BrdU injections administered increases over the experimental period. As maximum labeling is reached, LI values level off accordingly in each group. However, LI values plateau at an earlier time in Tg embryos, indicating that LI progresses to a maximum at a faster rate in Tg embryos and that TC - TS is reduced in Tg mice.

