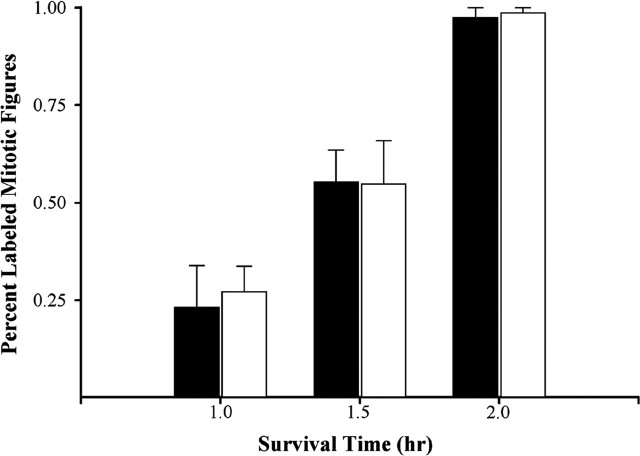
Figure 3.
Graph of the percentage of labeled mitotic figures over the dorsomedial sector of the cerebral wall at 1.0, 1.5, and 2.0 hr after a single injection of BrdU was administered to a timed-pregnant dam on E14 (Tg, open bars; control, filled bars). Error bars represent the SEM. The graph shows that the percentage of labeled mitotic figures does not differ significantly between groups at any of the times examined. By 2.0 hr after injection, essentially all mitotic figures are labeled in Tg and control embryos. Therefore, the combined length of the G2 and M phases is 2.0 hr in both groups.

