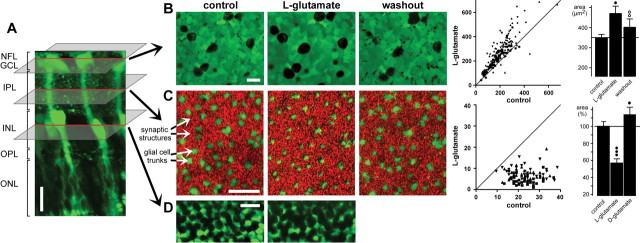
Figure 1.
Glutamate evokes morphological alterations in whole-mount guinea pig retinas. A, In a retinal slice, Mitotracker Orange (10 μm) selectively stained glial (Müller) cells (green). NFL, Nerve fiber layer; OPL, outer plexiform layer; ONL, outer nuclear layer. B, Bath application of l-glutamate (1 mm) resulted in a reversible swelling of the neuronal cell bodies within the GCL-NFL (left). The view of the GCL-NFL shows unstained somata that are surrounded by glial cell end feet that are green labeled by Mitotracker Orange. The images were recorded before (control), 10 min after the onset, and 40 min after the end of agonist application. Middle, Scatter plot of the cross-sectional areas of neuronal cell bodies (in square micrometers) within the GCL-NFL that were measured before and during glutamate exposure (n = 208 somata from 4 whole mounts), clearly showing agonist-evoked cell body swelling. Right, Mean (±SD) cross-sectional areas of neuronal cell bodies within the GCL-NFL before (control), 10 min after the onset, and 40 min after the end of glutamate application. (Data were obtained from 88 cells from 3 whole mounts.) C, Recordings were made with the focal plane at the IPL displaying profiles through Müller cell stem processes (green stained by Mitotracker) and synaptic structures between them (red). Application of l-glutamate (1 mm) for 10 min decreased reversibly the thickness of the glial cell profiles. The recovery was recorded after 30 min washout. Middle, Histogram showing cross-sectional areas of glial cell profiles (in square micrometers) in the IPL (n = 105 cells from 3 whole mounts) that were measured before and during agonist application. Right, Mean (±SD) cross-sectional areas of glial cell profiles within the IPL before (control) and 10 min after application of l-glutamate (1 mm) or d-glutamate (1 mm). The data were obtained in five independent experiments. D, l-Glutamate-evoked morphological alterations in the INL. After a 10 min agonist exposure, the neuronal cell bodies (dark round structures) were swollen, whereas the green-stained glial cell bodies displayed a decreased thickness. Scale bars, 20 μm. Significant differences versus control: •p < 0.05; •••p < 0.001. Significant effect of washout: ○○p < 0.01.

