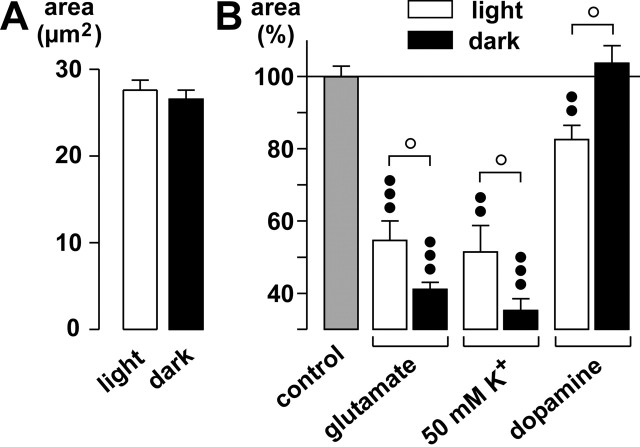
Figure 9.
The changes of the glial cell morphology differ in their amplitudes during dark and light. A, Mean (±SEM) areas of the glial cell profiles in the IPL during light and dark. B, Effects of glutamate (1 mm), of a solution containing 50 mm K+, and of dopamine (100 μm) on glial cell morphology. The effects were measured after 5 min (50 mm K+) and 10 min exposures, respectively. The cross-sectional areas of the glial cell stem processes in the IPL are given as percentage of control (100%). The data were obtained in four to nine independent experiments. Significant differences versus control: ••p < 0.01; ○○○p < 0.001. Significant differences between light and dark: ○p < 0.05.

