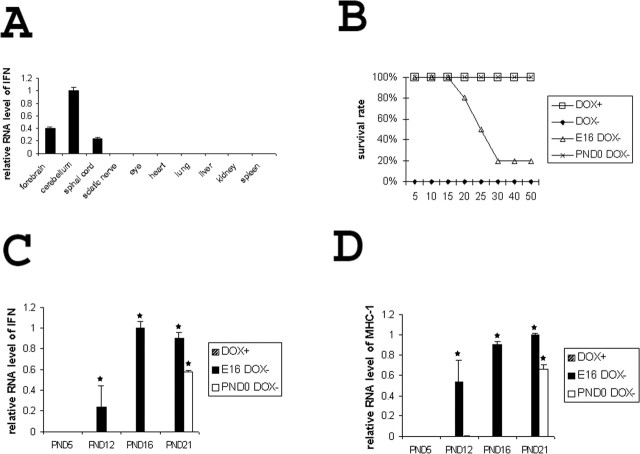
Figure 2.
Kinetics of IFN-γ expression. A, Real-time PCR analysis of the expression pattern of IFN-γ in P16 double transgenic mice released from doxycycline on E16 (n = 3). B, Survival curve of double transgenic mice (n > 100 for each group). C, IFN-γ real-time PCR analysis in the cerebellum (n = 3). *p < 0.01. D, MHC-I real-time PCR analysis in the cerebellum (n = 3). *p < 0.01. DOX+, Animals continuously receiving doxycycline; DOX-, animals never receiving doxycycline; E16 DOX-, animals released from doxycycline on E16; PND0 DOX-, animals released from doxycycline on P0.

