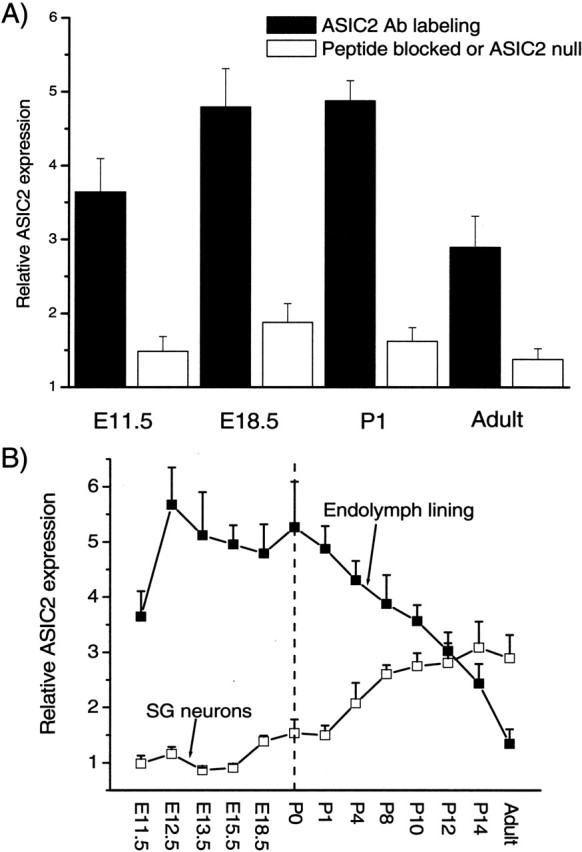
Figure 7.

Quantification of ASIC2 labeling intensity in cells lining the endolymphatic space and in SG neurons. A, Relative labeling intensity of ASIC2 (y-axis) at various developmental stages (x-axis) was obtained by comparing labeled regions with background regions in the same cochlear sections. B, The specificity of the labels by the ASIC2 antibody is shown by a large reduction in the relative labeling intensity caused by either a peptide block (unfilled bars) or the absence of labeling in cochlear sections obtained from ASIC2 null mice (last unfilled bar on the right). Error bars indicate SEM.
