
Figure 4.
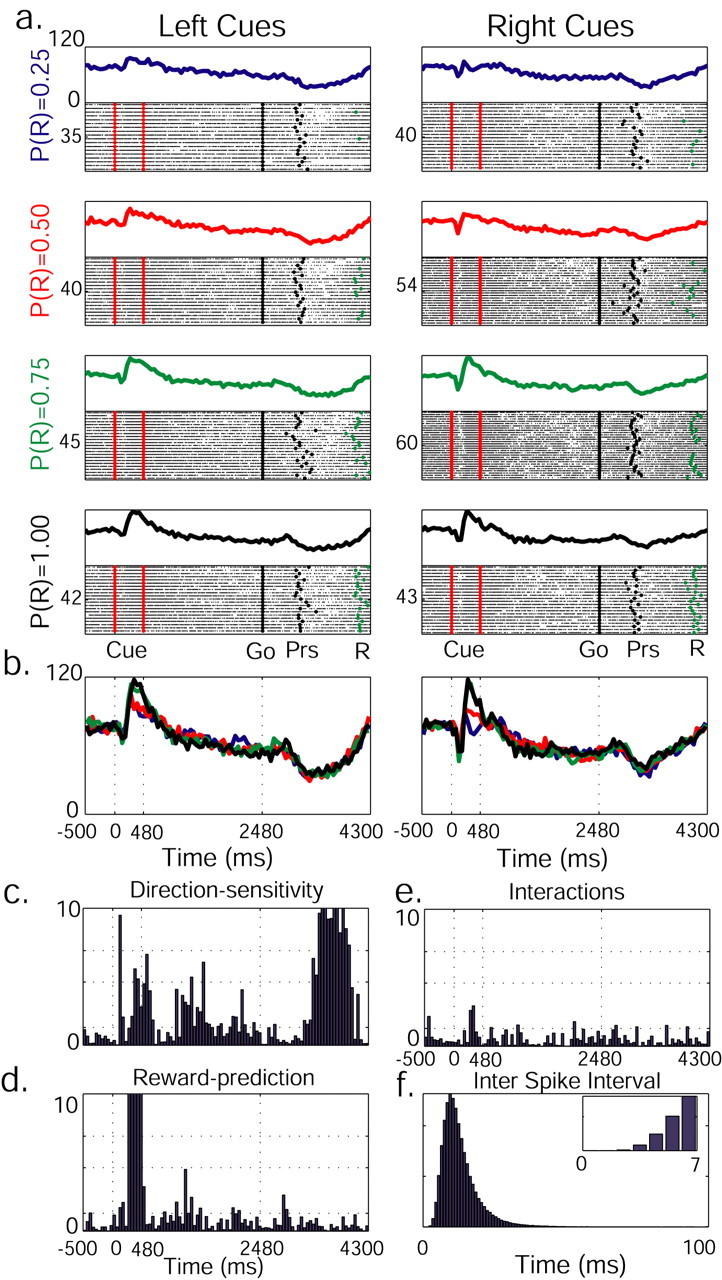
The activity of a single pallidal neuron is dynamically modulated by both future reward probability and direction of movement. a, Raster plot and PSTH are presented for each reward probability and cue position. The raster plots were diluted (1:2 trials) to enhance visibility. On raster plots, significant behavioral events are marked with dots (red, cue presentation; black, “go” signal and button press; green, reward delivery). The PSTH is built of 50 msec bins. On the left of each raster plot is the number of trials. During cue display, neuronal activity increases with reward probability increment. b, PSTHs for different reward probabilities are overlaid: P(R) = 0.25 (blue), P(R) = 0.50 (red), P(R) = 0.75 (green), P(R) = 1.00 (black). c, Neuronal activity as modulated by left/right trials. A two-way ANOVA on spike counts in parallel time-lag bins was performed, and log(p) was calculated. Cue onset, offset, and “go” signal are marked with vertical dotted lines. Direction-sensitive activity during the reward-delay period might be related to the planning of the movement back to the central key in preparation for the next trial. d, Modulation of neuron activity by reward probability. e, p values reflecting interactions between the two parameters. In c-e, significance levels are marked with dotted horizontal lines (p = 0.05, p = 0.01, p = 0.001). f, Interspike interval diagram of the neuron presents a clear refractory period (see inset for higher time resolution).