
Figure 5.
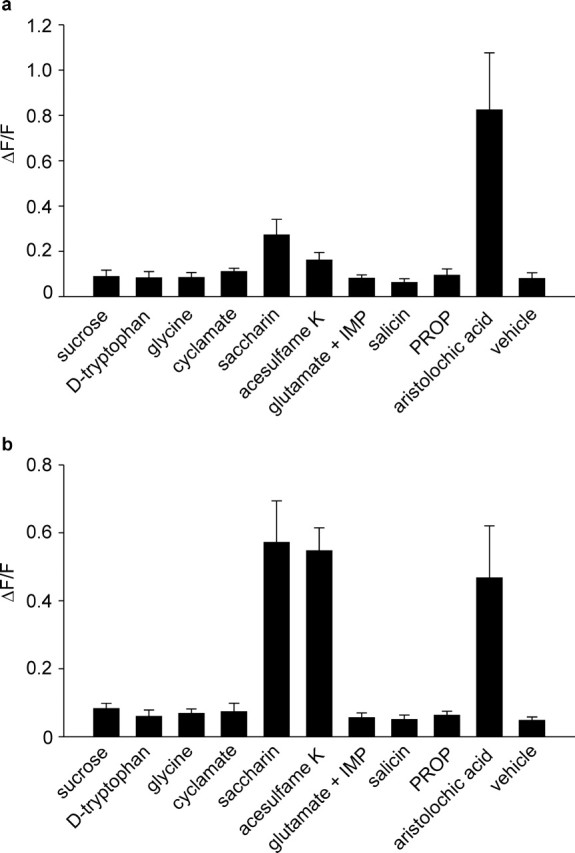
Responses of hTAS2R43- and hTAS2R44-expressing cells to various taste compounds. Calcium responses of cells expressing hTAS2R43 (a) and hTAS2R44 (b) that have been challenged with vehicle (control), sucrose (75 mm), d-tryptophan (10 mm), glycine (75 mm), Na-cyclamate (10 mm), Na-saccharin (10 mm), acesulfame K (10 mm), a mixture of Na-glutamate (10 mm) and inosine monophosphate (1 mm) (glutamate + IMP), salicin (10 mm), propylthiouracil (PROP) (0.25 mm), or aristolochic acid Na-salt (0.01 mm). Data of three independent experiments performed in quadruplicate were processed in SigmaPlot. Data were corrected for and normalized to background fluorescence.