
Figure 8.
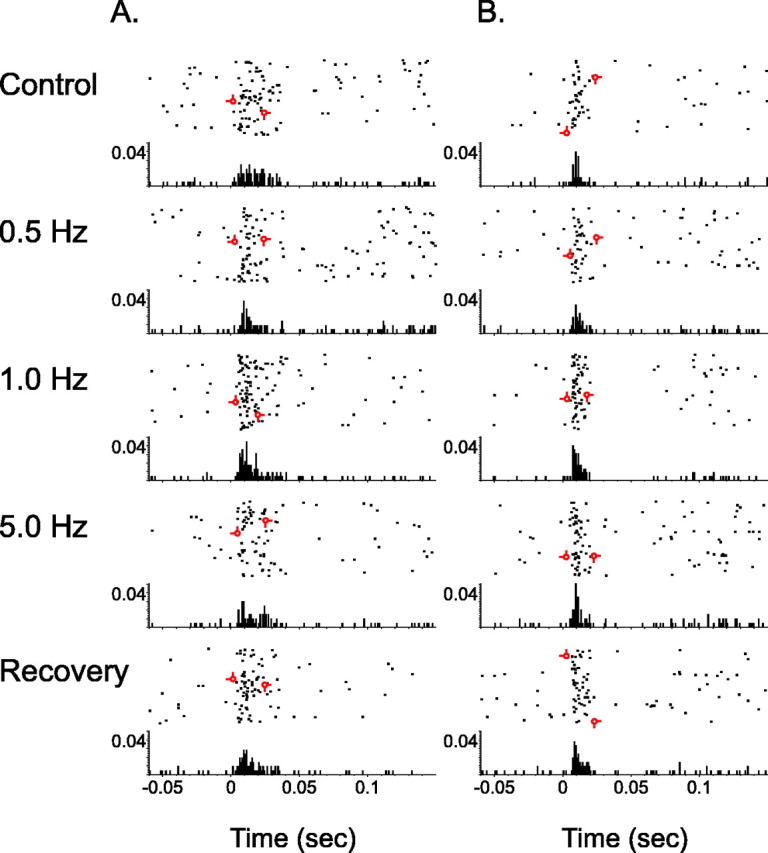
Effects of LC activation on temporal aspects of sensory-evoked neuronal discharge in the thalamus and cortex. Perievent rasters and associated histograms illustrate the stimulus-evoked discharge patterns for a single VPM thalamic neuron (A) or BF cortical neuron (B) during control, tonic LC stimulation intervals, and recovery. These cells were recorded simultaneously. The x-axis for both the raster and underlying PSTHs depicts time before and after whisker pad stimulus presentation (occurring at 0 sec.). The raster y-axis references trial number (top row, first trial), whereas the histogram y-axis indicates the probability of discharge in a given time bin (1 msec). Each cumulative raster/PSTH illustrates unit activity during an equal number of sensory stimulus presentations. As LC stimulation frequency was increased (i.e., up to 1.0 Hz), the duration of the whisker-evoked response was reduced. Additionally, modal latency and latency variance decreased with increasing frequencies of LC stimulation (i.e., up to 1.0 Hz). An additional increase in the frequency of LC stimulation suppressed the magnitude of neuronal response. Barbed open circles indicate the earliest and latest evoked first spike within the response window for each experimental condition. Note that variability in the onset of the evoked response as well as the time between first and last spike were reduced during the tonic 1.0 Hz LC stimulation condition.