Figure 1.
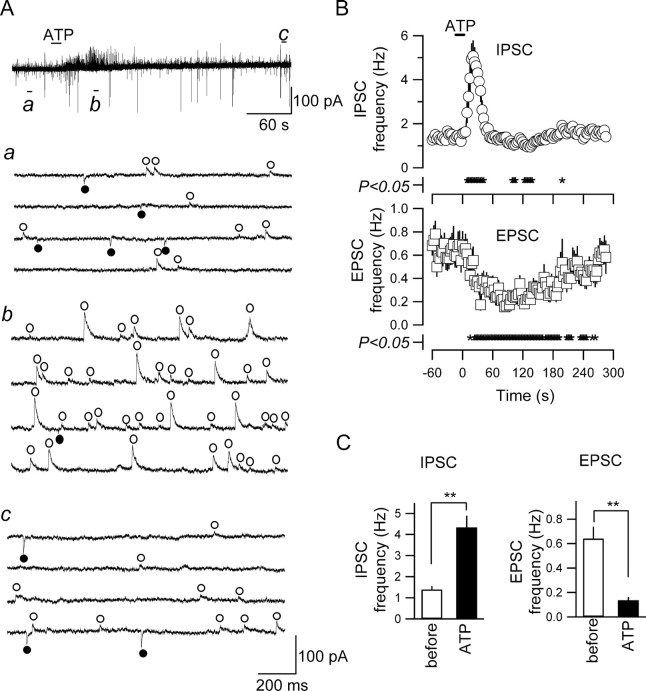
ATP increased IPSC frequency and decreased EPSC frequency. A, Simultaneous recording of EPSCs and IPSCs from a CA3 pyramidal neuron. ATP (1 mm) was applied at the horizontal bar. a-c are the time-extended traces taken at the points a-c in the trace in A. IPSCs and EPSCs (outward and inward events, respectively) are marked with open circles above the trace and filled circles below the trace, respectively. B, The time course of the changes in frequencies of IPSC and EPSC (top and bottom, respectively) with ATP application. Each point and vertical bar represents mean and SE of 22 neurons, onto which ATP (1 mm) was applied. The frequency became significantly different (p < 0.05; paired t test) from the preapplication value at the times marked with * at the bottom of plots. C, Summary of the effects of ATP on the frequencies of IPSC (left) and EPSC (right). **p < 0.01 (ANOVA); n = 22.

