
Figure 8.
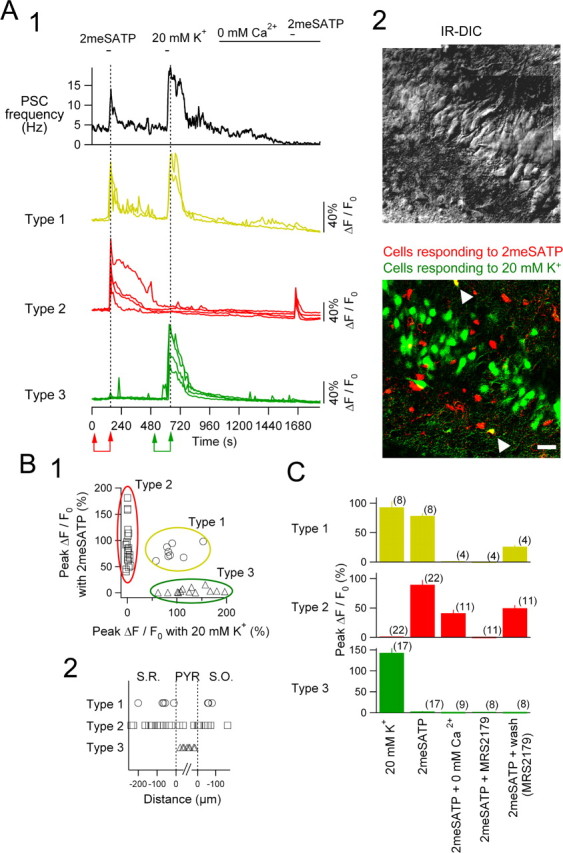
Imaging of [Ca2+]i in the CA3 slice with simultaneous recording of the postsynaptic current of a pyramidal cell. A1, Top trace, PSC frequency of a CA3 pyramidal neuron recorded with CsCl-based internal solution at a holding potential of -70 mV; bottom traces, relative changes in Fluo-4 fluorescence of 10 representing cells shown at the bottom of A2. For the classification of types 1-3, see Results. 2meSATP (100 μm) and 20 mm K+ solution were applied at the respective horizontal bars. The ACSF was replaced by the Ca2+-free ACSF during the period indicated with the horizontal bar denoted 0 mm Ca2+. A2, Top, An IR-DIC image showing the location of the CA3 peri-pyramidal layer in which [Ca2+]i imaging was made. Note a patch pipette on a pyramidal neuron in the center. Bottom, A merged image of two images: one showing cells responding to 2meSATP in red and another showing cells responding to 20 mm K+ in green. This projected confocal image indicates the same region as in the IR-DIC image of the top panel. Images of the cells responding to each solution were obtained by subtracting the fluorescence intensity of each pixel acquired before the application from that at the peak of the PSC effect (pairs of arrows in red and green at the bottom of A1). Note that two cells in the merged image in A2 are in yellow (white arrowheads), indicating that they responded to both 2meSATP and 20 mm K+ (type 1 cells in A1). Scale bar, 50 μm. B1, Relationship between changes in the fluorescence intensity (ΔF/F0) in response to 20 mm K+ (abscissa) and 2meSATP (ordinate). Three ovals in different colors indicate groups of neurons classified according to the responses to two solutions (see Results). B2, The relative location of cells analyzed. Abscissa indicates the distance of the cells from the borders of the pyramidal layers. The vertical dashed line in the left and right indicate the border between the pyramidal layer and the S.R. and S.O., respectively. C, The summary of changes in Fluo-4 fluorescence (ΔF/F0) of types 1-3 cells in response to 20 mm K+ and 2meSATP in the absence of extracellular Ca2+, in the presence of MRS2179 (30 μm), and its washout. Numbers in parentheses indicate the number of cells from six CA3 slices. Bars and vertical lines indicate mean and SE, respectively.