
Figure 2.
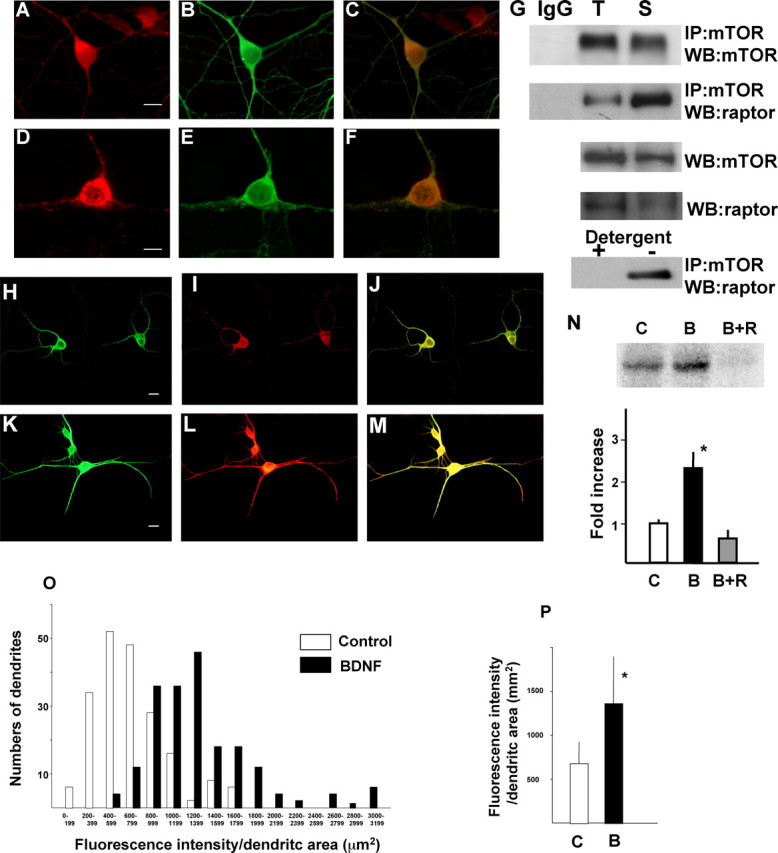
Distribution of mTOR and raptor and activation of mTOR by BDNF in dendrites. Double immunocytochemistry of raptor (A) and MAP2 (B) are shown. The merged image is shown in C. Double immunocytochemistry of mTOR (D), raptor (E), and their merged image (F) are shown. Scale bars, 10 μm. G, Western blotting of mTOR-associated raptor and mTOR itself were detected in total lysate (T) and in synaptoneurosomes (S), after immunoprecipitation with anti-mTOR antibody. IgG indicates normal mouse IgG that was used as a control for immunoprecipitation. Western blotting of raptor in total lysate or synaptoneurosome lysate is also presented. Detergent sensitivity of the association is shown in the bottom panel. Phosphorylation of mTOR in control (H-J) and BDNF (100 ng/ml)-treated (K-M) neurons was detected by immunocytochemistry with anti-phospho-mTOR (I, L). Double immunostaining was performed with anti-MAP2 antibody (H, K). Merged images are shown in J and M. Scale bars, 10 μm. Enhancement of mTOR kinase activity against recombinant GST-4EBP1 in synaptoneurosomes is shown. C, Control; B, BDNF (100 ng/ml); B+R, BDNF plus rapamycin (20 ng/ml). Phosphorylated GST-4EBP1 was detected by autoradiography after SDS-PAGE and analyzed by densitometry (n = 4). *p < 0.005 (ANOVA). Summary histogram indicating the fluorescence intensity distributions for control and BDNF-treated dendrites (n = 100 of randomly chosen cells from 3-4 different culture dishes in each group). Dendritic area was calculated by measuring MAP2-positive dendrites (green fluorescence), and the intensity of red fluorescence, which reflected phospho-mTOR signal, in each dendrite was measured (O). A summary diagram indicating the mean intensity in dendrites of both conditions is shown in P. Bars represent mean + SD. *p < 0.001 (t test).