
Figure 3.
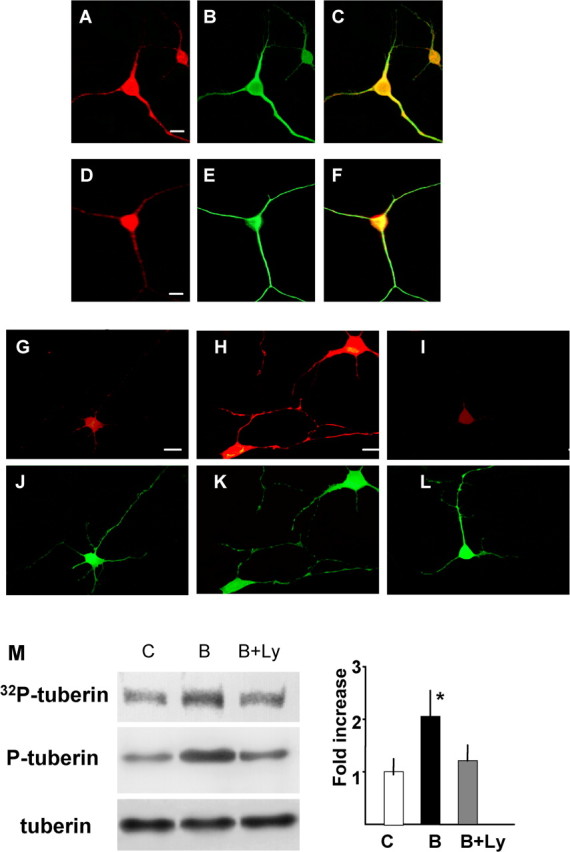
Distribution of tuberin and activation of tuberin by BDNF in dendrites. Double immunocytochemistry of tuberin (A), RheB (D), and MAP2 (B, E). The merged image is shown in C and F, respectively. Scale bars, 10 μm. Phosphorylation of tuberin in control (G, J), BDNF (100 ng/ml)-treated (H, K), and BDNF plus Ly294002 (10 μm)-treated (I, L) neurons was detected by immunocytochemistry with anti-phospho-tuberin (G-I). Double immunostaining was performed with anti-MAP2 antibody (J-L). Scale bars, 10 μm. M, Enhancement of tuberin phosphorylation was induced by BDNF in synaptoneurosomes. Synaptoneurosomes were incubated with or without BDNF and [32P]γ-ATP. Samples were immunoprecipitated with anti-tuberin, and phosphorylated tuberin was detected by autoradiography after SDS-PAGE (top). Synaptoneurosome samples were also applied for Western blotting (middle and bottom). The right panel shows the result of densitometric analysis. Bars [white, control (C); black, BDNF (B); gray, BDNF plus Ly294002 (B+Ly)] represent means ± SD (n = 4). *p < 0.005 (ANOVA).