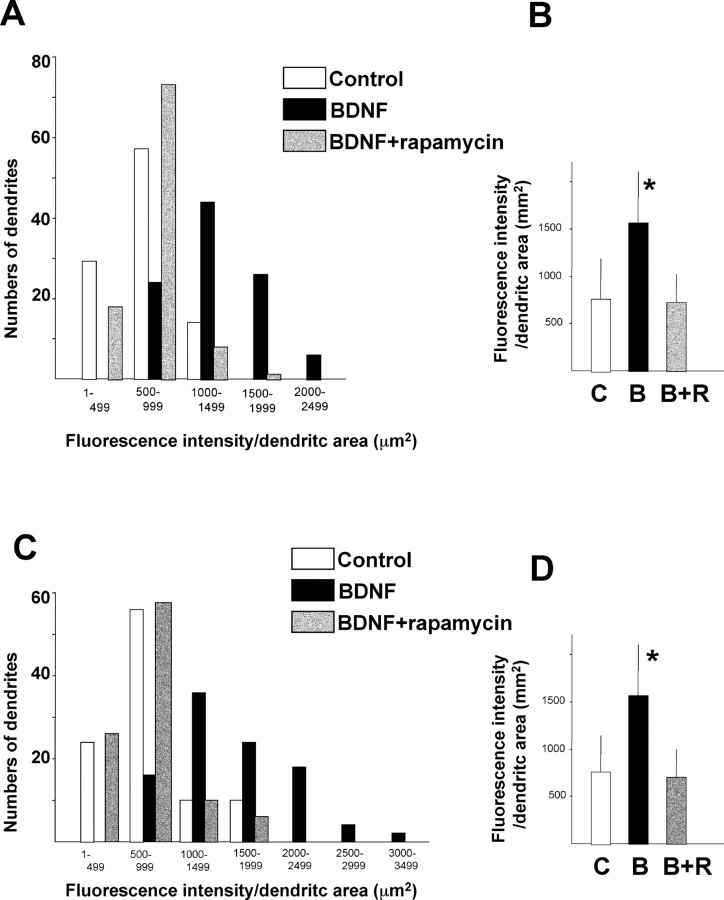
Figure 6.
Quantitation of dendritic phosphorylation of 4EBP and p70S6K. A summary histogram indicating the fluorescence intensity distributions for control (C; white bars), BDNF-treated (B; black bars), and BDNF plus rapamycin-treated (B+R; gray bars) dendrites (n = 100 of randomly chosen cells from 3-4 different culture dishes) is shown. The dendritic area was calculated by measuring MAP2-positive dendrites (green fluorescence), and the intensity of red fluorescence, which reflected phospho-4EBP (A) or phospho-p70S6K (C) signal, in each dendrite was measured (n = 100). Summary diagrams indicating the mean intensity in dendrites of each condition are shown in B (P-4EBP) and D (P-p70S6K). Bars represent mean + SD. *p < 0.005 (ANOVA).

