
Figure 8.
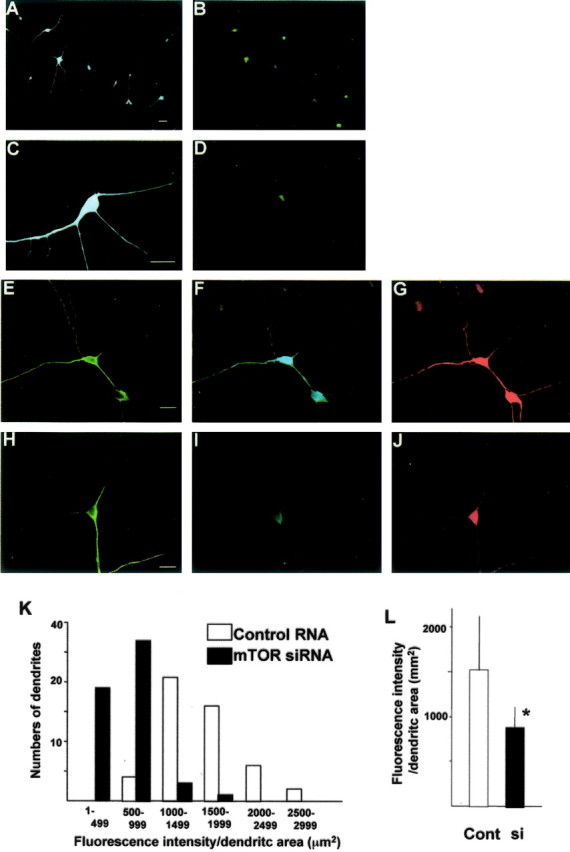
Uptake of mTOR siRNA into neurons and the effects of mTOR siRNA on mTOR protein level and downstream P-p70S6K. Neurons were incubated with mTOR siRNA labeled with FITC for 8 hr and immunostained with mouse monoclonal anti-MAP2 antibody. MAP2 signal was visualized with pacific blue-labeled anti-mouse IgG (A, C). siRNA taken up into neurons was detected as green (FITC) fluorescence (B, D). C and D are higher-magnification photomicrographs. Triple immunocytochemistry with anti-MAP2 (chick), anti-mTOR (rabbit), and anti-phospho-p70S6K (mouse) and visualized with FITC-conjugated anti-chick IgG (green), pacific blue-conjugated anti-rabbit IgG (blue), and Alexa546-conjugated anti-mouse IgG (red), respectively, is shown. Neurons incubated with control (E-G) or mTOR (H-J) siRNA for 48 hr were treated with BDNF. Scale bars, 10 μm. A summary histogram indicating the fluorescence intensity distributions for control or mTOR siRNA-treated dendrites (n = 100) is shown. The dendritic area is calculated by measuring MAP2-positive dendrites (green fluorescence), and the intensity of red fluorescence, which reflects phospho-S6K signal, in each dendrite is measured (K). A summary diagram indicating the mean intensity in dendrites of both conditions is shown in L. Cont, Control; si, siRNA. Bars represent mean + SD. *p < 0.005 (t test).