Figure 3.
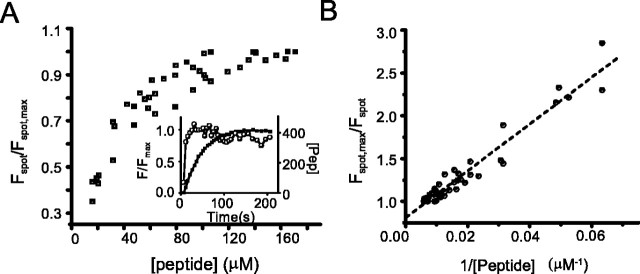
Measurements of peptide affinity for spots. Bipolar cells were loaded with 415 μm fluorescein-labeled peptide and imaged using TIRFM. The fluorescence intensity of spots were measured (Fspot) and normalized to the maximum fluorescence for that spot (Fspot, max) over the time course of cell loading. The fluorescence of the cytoplasm outside the fluorescent spots was taken as an index of cytosolic peptide concentration. A, Fspot/Fspot, max is plotted as a function of peptide concentration ([peptide]) within the cell. Inset shows one example of a plot of fluorescence as a function of time for a spot (open circles) and in the cytoplasm (filled squares). The right axis in the inset shows the conversion of cytoplasmic fluorescence to peptide concentration, assuming that the asymptotic concentration is the same as the pipette concentration. Note that fluorescence of the spot saturates sooner than the cytoplasmic fluorescence. B, Plot of Fspot, max/Fspot versus [peptide]-1. First-order binding predicts a linear relationship with a slope equal to the Kd (see Materials and Methods). Slope of linear least-squares fit indicates a Kd of 27 μm.

