Figure 6.
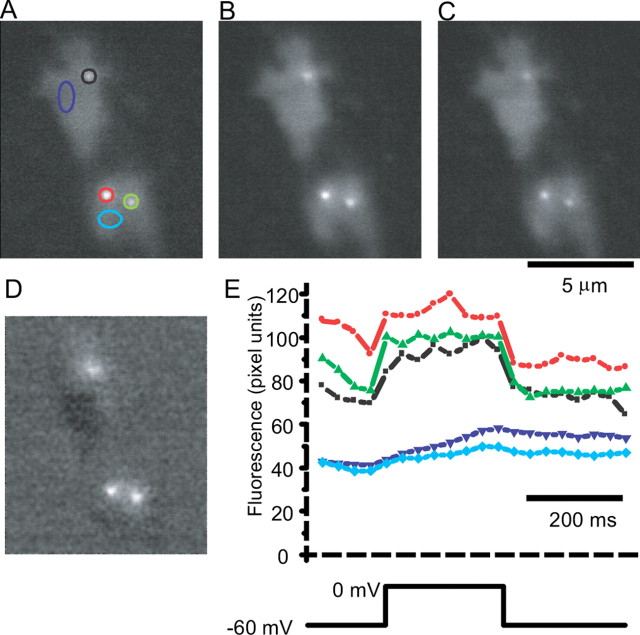
Ribbons colocalize with calcium entry sites. Bipolar cells were loaded with the fluorescent CtBP-binding peptide (28 μm), Fluo-5f (100 μm), and 10 mm EGTA and imaged using TIRFM. TIRFM images the region of the cell that is adherent to the glass, and in this example the cell adhered in two locations. A, Fluorescence collected and averaged for 250 msec just before a depolarization to 0 mV. B, Fluorescence collected and averaged during a 250 msec depolarization to 0 mV. C, Fluorescence collected for 250 msec immediately after return of the membrane potential to its resting potential of -60 mV. D, Image of B subtracted by the average of the images in A and C. E, Top shows fluorescence in regions marked in A. Note the rapid change in fluorescence at locations near spots seen at rest but not at other locations within the terminal.

