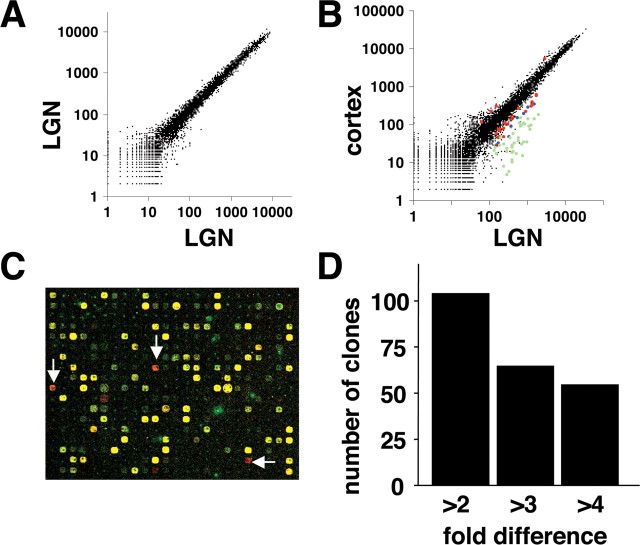
Figure 1.
Fabrication and validation of a custom ferret cDNA microarray. A, Autocorrelation plot. Two samples derived from the same mRNA pool were separately labeled with Cy3 or Cy5 and then analyzed using the ferret microarray. After background signal intensities were subtracted, the mean signal intensities from all cDNA spots were plotted on log scales. B, Comparison of gene expression in the LGN and visual cortex at P16. Clone reproducibly exhibiting more than twofold differences are labeled with colors in the scattergram. Red, blue, and green indicate more than twofold, threefold, and fourfold differences, respectively. C, A false-color image of the ferret microarray. Red spots (arrows) indicate clones that are abundantly expressed in the LGN compared with visual cortex. D, The number of the clones that showed reproducible differences in expression between the LGN and visual cortex.

