
Figure 1.
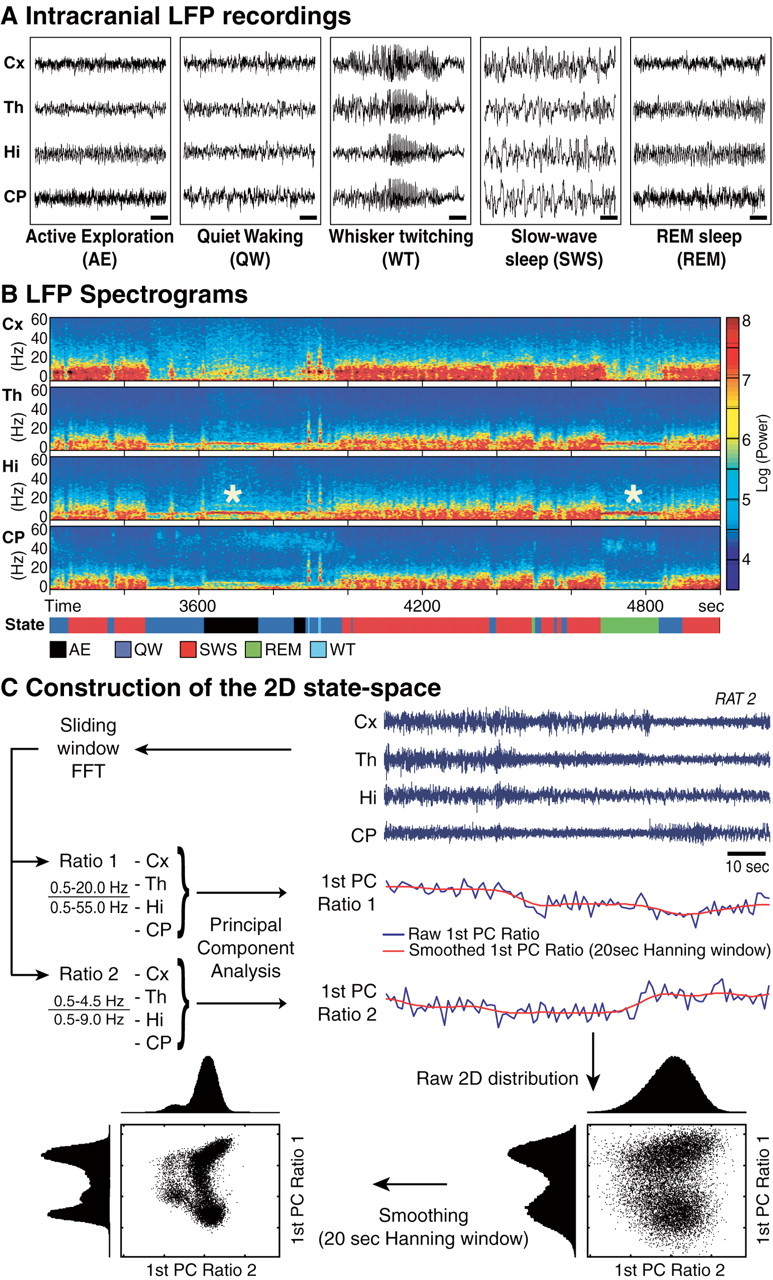
Intracranial local field potentials and behavioral states. A, Raw simultaneous LFP recordings in the four areas of interest. Calibration bar, 1 sec. Five brain states were initially distinguished by visual inspection of LFP traces and behavior. B, LFP power spectrograms, aligned with the color-coded hypnogram, i.e., the temporal sequence of the behavioral states assessed by visual observation of the behavior and inspection of the concurrent LFP features. All areas show simultaneous state-dependent variations of LFP spectral pattern. Notice that AE (black) and REM (green) both show pronounced theta rhythm (white asterisk). C, Construction of the 2-D state space. After elimination of segments with amplitude saturation (representing <1% of the total duration in each rat), a sliding window Fourier transform was applied to each LFP signal to calculate two spectral amplitude ratios. PCA was then applied to these ratios obtained from all LFP channels, and the first PC was used as the overall ratio measure. These measures obtained for each second of data were further smoothed with a Hanning window (20 sec length). Plotted against each other, the two first PCs of spectral ratios define the 2-D state space. Note that clear cluster structures emerged in the 2-D state space after smoothing (the 1-D histogram became more compact after smoothing).