
Figure 7.
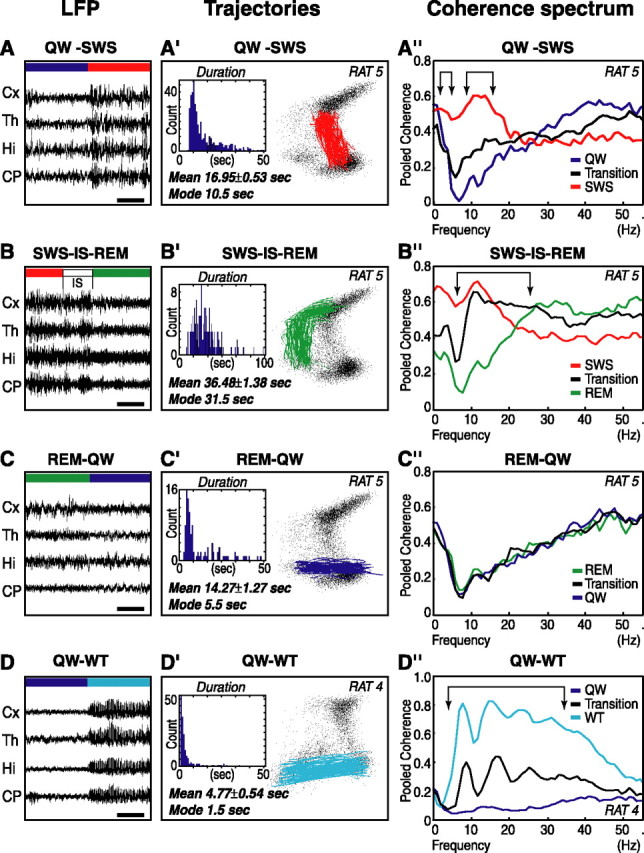
Coherence spectra at state transitions. Four common global brain state transitions of a representative animal are presented with an example of LFP recordings (first column), the corresponding spectral trajectories and their duration within the 2-D state space (second column), and an averaged pooled coherence spectrum for the pre- and post-states and the transition itself (third column). LFP, Recordings of the four areas revealed common oscillatory features and simultaneous changes during state transitions. Calibration bar, 5 sec. Trajectories, Paths connecting major clusters were identified, and histograms of the distribution of duration (insets) were calculated for these trajectories. The average and mode ± SEM of the duration are indicated for this animal (see supplemental Fig. S7, available at www.jneurosci.org as supplemental material). Coherence spectrum, Average coherence spectrum of transitions plotted against the average coherence spectrum of the pre- and post-states, whose points were taken from time points immediately adjacent to the selected trajectories with the same duration as the trajectory. Arrows indicate frequency bands at which significant changes in LFP coherence occur during the transition.