Figure 4.

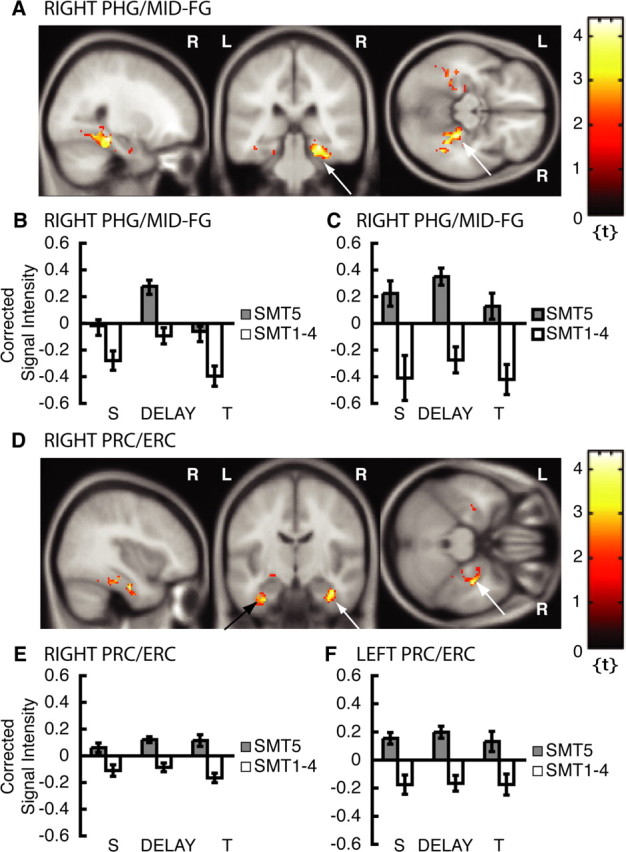
fMRI results from subsequent memory analysis across match and nonmatch trials (double or single stimulus presentations). Please note that only activation within ROIs is superimposed on canonical average T1-weighted ICBM/MNI brain. A, Right PHG/mid-FG, x = 26, y = -32, z = -14 (arrows). B, Corrected signal intensities during sample presentation (S), delay period (DELAY), and test presentation (T) from right PHG/mid-FG for DMS trials (across match and nonmatch trials, double or single stimulus presentations); SMT5 > SMT1-4. C, Corrected signal intensities from right PHG/mid-FG for DMS trials that were nonmatches (single stimulus presentations); SMT5 > SMT1-4. D, Right PRC/ERC, x = 38, y = -12, z = -26 (white arrows); and left PRC/ERC, x = -28, y = -8, z = -34 (black arrow). E, Corrected signal intensities from right PRC/ERC for DMS trials (across match and nonmatch trials, double or single stimulus presentations). F, Corrected signal intensities from left PRC/ERC for DMS trials (across match and nonmatch trials). y-Axes, Signal intensity grand mean scaled to 100 and global calculation using mean voxel value (within per image full mean/eight mask). R, Right; L, left.
