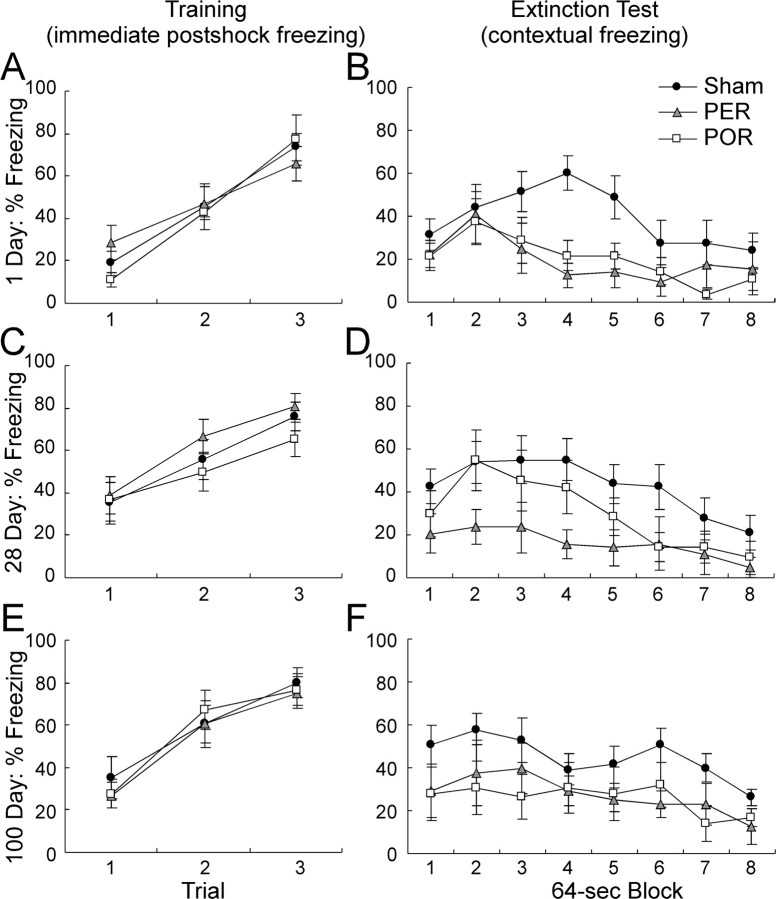
Figure 3.
Percentage of freezing after training and during extinction tests. Training data are shown in the left panels, and extinction data are shown in the right panels for control subjects and rats receiving PER or POR lesions. Lesions were produced 1 d (A, B), 28 d (C, D), or 100 d (E, F) after surgery. The training data are the percentage of immediate postshock freezing in the 64 sec after each trial. Extinction data are the percentage of freezing collapsed over the eight 64 sec blocks of the extinction test. Data are mean ± SEM.

