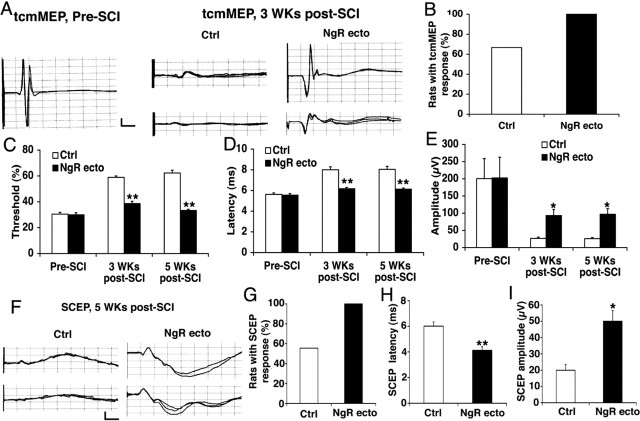
Figure 6.
Intrathecal delivery of NgR(310)ecto-Fc promotes signal conduction in injured spinal cord. A, Representative tcmMEP responses recorded from one pre-SCI rat, two control rats, and two NgR(310)ecto-Fc rats 3 weeks after SCI by transcranial magnetic stimulation. Calibration: 5 msec, 50 μV. B, A tcmMEP response was detected from all the rats treated with NgR(310)ecto-Fc protein (n = 18 legs from 9 rats) but were recorded from only 64% of rats in the control group (n = 18 legs from 9 rats) 5 weeks after injury. C-E, Bar graphs indicate the stimulation threshold (C), onset latency (D), and amplitude (E) for tcmMEP recorded from the preinjury rats (n = 12 legs from 6 rats), control SCI rats (n = 12 legs from 6 rats), and NgR(310)ecto-Fc-treated rats (n = 18 legs from 9 rats) 5 weeks after SCI. The stimulation threshold is reported as a percentage of maximal power delivered to the magnetic coil. F, Representative SCEP responses recorded from two control and two NgR(310)ecto-Fc rats 5 weeks after SCI with electrical stimulation of dCST area at T1 spinal level. Calibration: 5 msec, 50 μV. G, The SCEP responses were recorded from all the rats receiving NgR(310)ecto-Fc treatment (n = 9 rats) but were only recorded in 55% of rats treated with vehicle (n = 9 rats) 5 weeks after SCI. H, I, Bar graphs indicate the onset latency (H) and amplitude (I) of SCEP from control rats (n = 5 rats) and NgR(310)ecto-Fc-treated rats (n = 9 rats) 5 weeks after the lesion. Means + SEM are reported in all the graphs. The values of the NgR(310)ecto-Fc group are statistically different from control (*p < 0.05; **p < 0.01; Student's t test).

