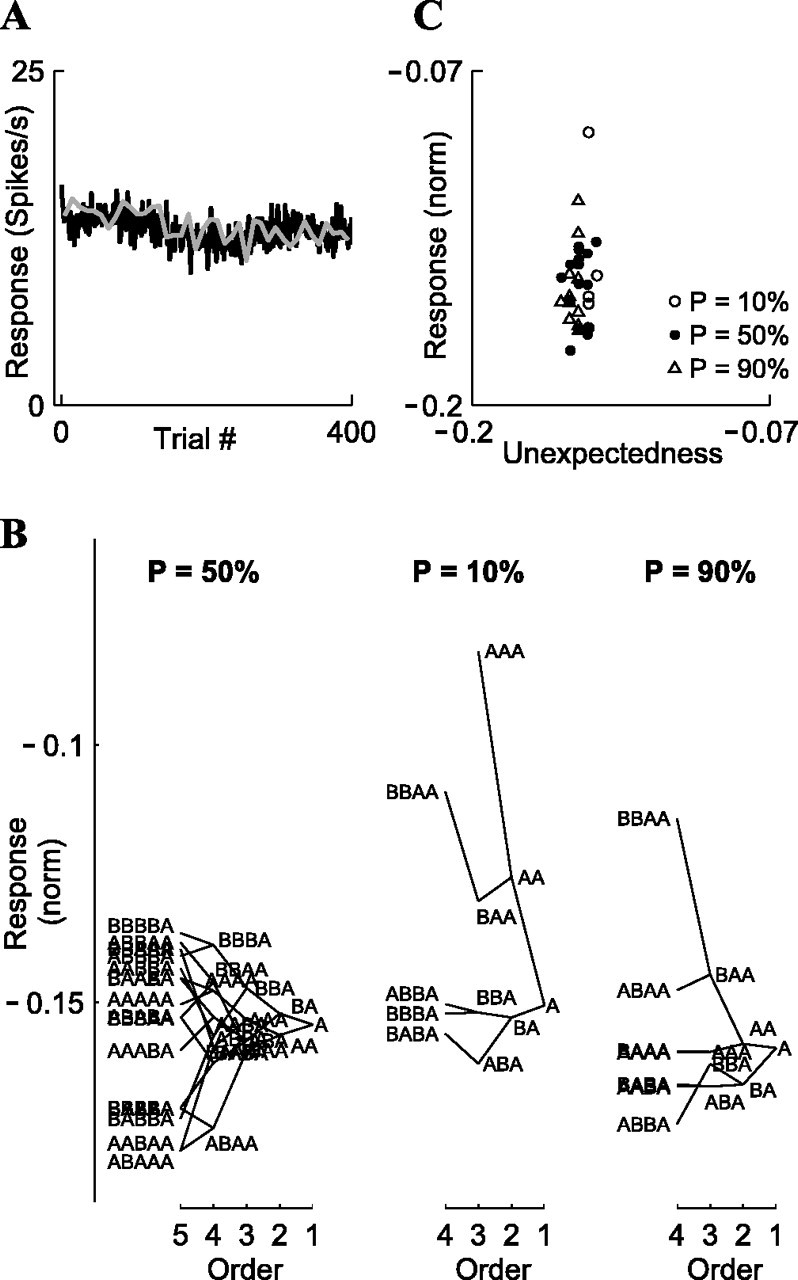
Figure 10.

No adaptation in auditory thalamus (MGB; n = 27 neurons; p = 90/10%; Δf = 0.10). A, Time course of mean population responses to the oddball stimuli, showing no decline over trials (gray, deviant; black, standard) (compare Fig. 5D). Data for p = 50% were not plotted here, because of the smaller number of neurons (n = 17). B, Local history trees (compare Fig. 7). C, The linear model of stimulus “unexpectedness” provides a poor fit to MGB responses (compare Fig. 8). In both B and C, some dots were missing for the p = 10% and p = 90% conditions, because not all possible sequences occurred in the data.
