Figure 3.

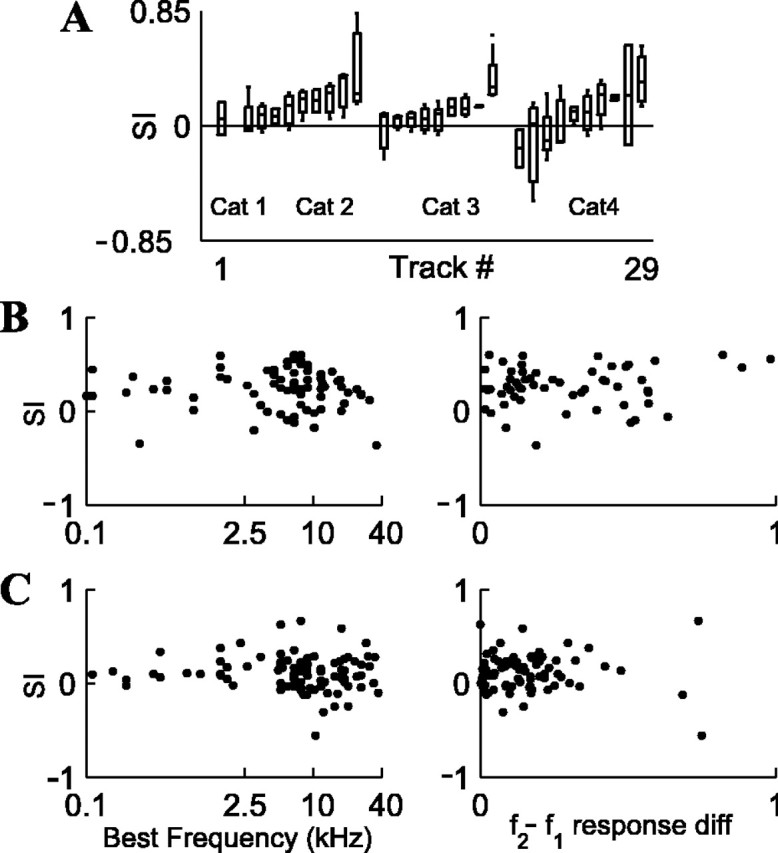
A, Adaptation columns in A1: box plots of SI values for neurons recorded along the same electrode track (29 tracks from 4 cats), sorted for each cat in ascending order of average SI. Each box plot represents the median, interquartile range, and total range of SIs along a single electrode track. Only electrode tracks with two neurons or more are shown (total n = 91 neurons). In cat 1, only a single track was recorded (track #1). Data are for p = 90/10%; Δf = 0.10. B, No correlation between the SI and the BF of the neuron (left; n = 76 neurons) or the f2 - f1 response difference (right; n = 56) for p = 90/10%, Δf = 0.37. C, Same lack of correlation for p = 90/10%, Δf = 0.10 (n = 90 and 81 for left and right panels, respectively).
