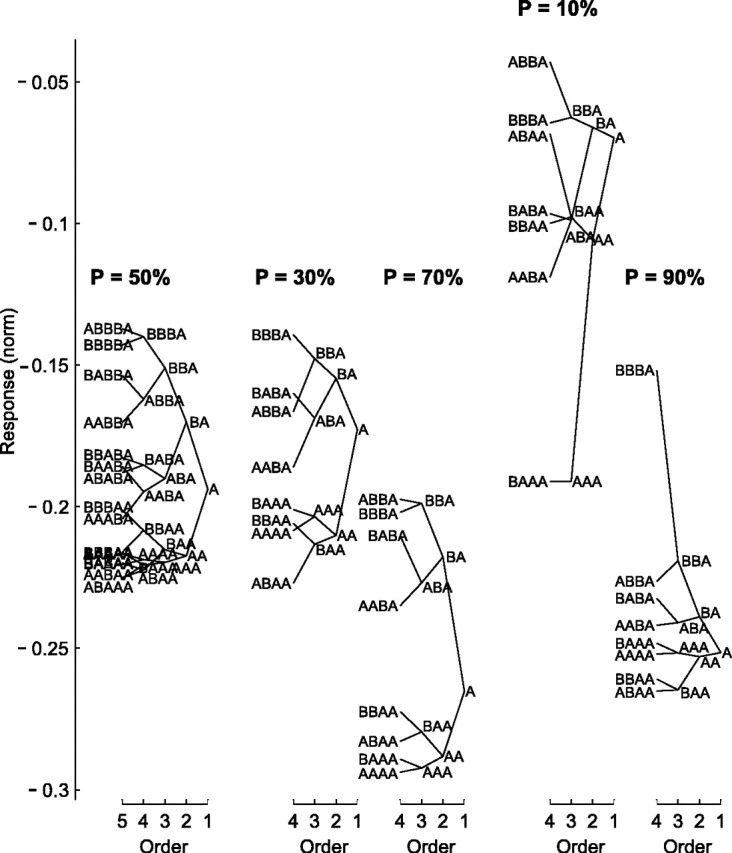
Figure 7.

Local history trees for the responses to the oddball stimuli, for Δf = 0.37, computed separately for each of the five stimulus probabilities (p = 10, 30, 50, 70, and 90%). Ordinate, Mean normalized response to a stimulus, grouped according to the preceding stimulus sequence, starting from the stimulus (A) and ending with fourth-order sequences (e.g., BBBA) (see Results). The fifth-order sequences (e.g., BBBBA), were much less orderly and therefore were drawn only for p = 50% for illustration. Each sequence in the tree connects with two higher-order sequences (corresponding to the addition of B or A before that sequence) and one lower-order sequence. All of the plotted sequences are based on averaging of at least 25 repetitions among all trials × all neurons (the AAAA sequence for p = 10% did not meet this criterion and therefore was omitted). Trees for p = 50, 10, and 90% are based on 68 neurons; trees for p = 30 and 70% are based on 29 neurons.
