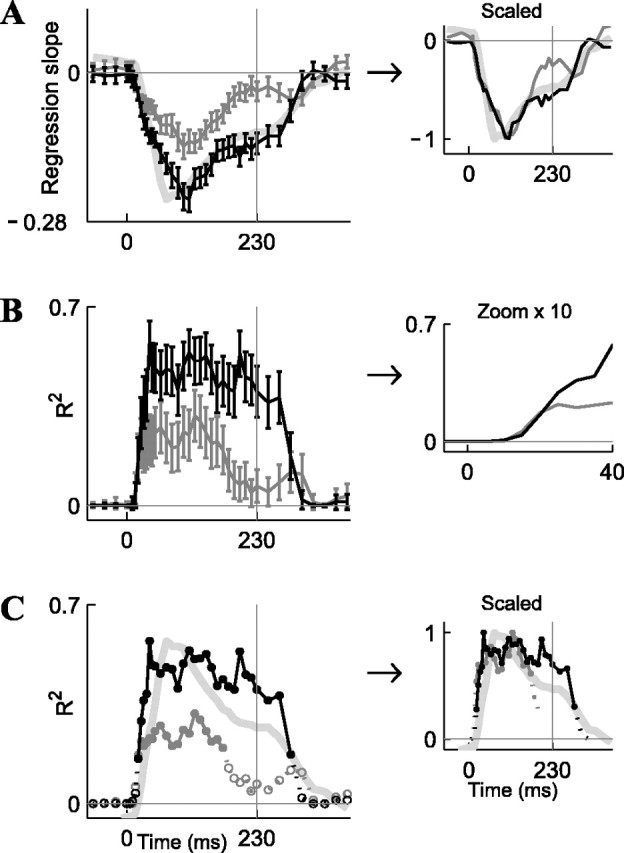
Figure 9.

Dynamics of the fits to the linear model of Figure 8, computed using a 50 msec sliding window. The windows were shifted by 20 msec (before and after the stimulus), 10 msec (during the stimulus), or 5 msec (during the onset responses). The abscissa denotes the centers of the 50 msec bins. The vertical lines indicate time of stimulus offset (t = 230 msec). A, Regression slopes of the model, separately for the global probability p (black) and local sequence M (dark gray). Light gray, Difference between the population response to the deviant and the standard, DS = PSTH(Deviant) - PSTH(Standard), inverted and scaled. Inset, Scaling of all three curves to the same minimum. B, Fraction of variance explained by the model R2. Inset, “Zoom in” on the initial time. C, Fraction of variance explained by the model, R2, showing separately the significant time bins (filled circles and solid lines) and nonsignificant time bins (empty circles and dotted lines). Light gray, DS = PSTH(Deviant) - PSTH(Standard). Inset, Scaling all three curves to the same maximum.
