
Figure 4.
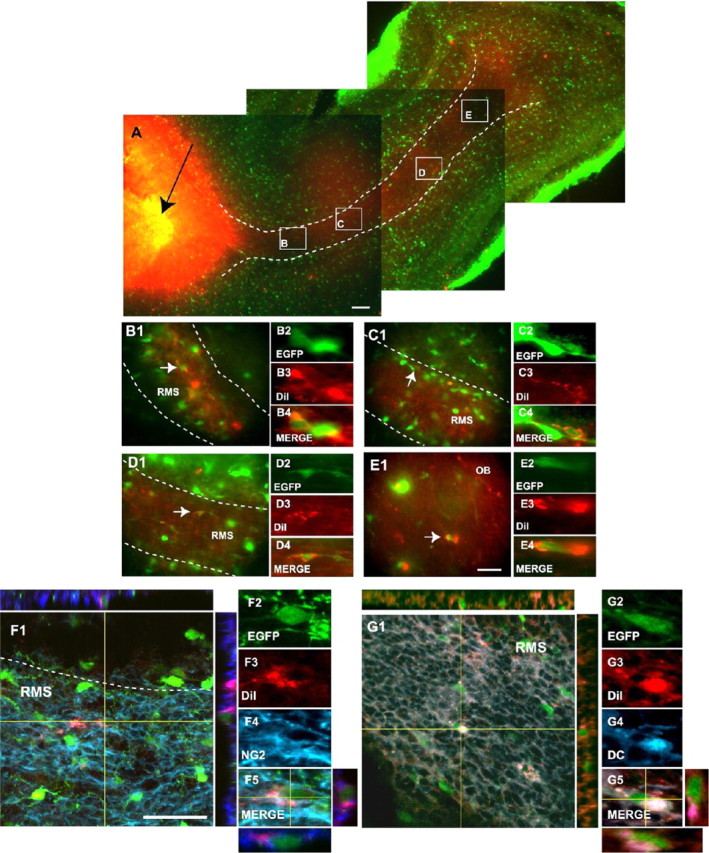
NG2+ cells migrate from the SVZ into the RMS. A-E, Reconstruction of a parasagittal brain section of a P8 CNP-EGFP mouse 4 d after DiI injection into the LV (black arrow). EGFP+ cells were found throughout the entire RMS and displayed morphologies of migratory cells. B-D, At this time, a small percentage of DiI+/EGFP+ (red/green) cells were also found in the OB (E). Boxes in A (B-E) are shown at a higher magnification, and individual DiI+/EGFP+-labeled cells (white arrows) are also displayed at a higher magnification. F, G, A percentage of the migrating DiI+/EGFP+ cells express NG2 (F4; blue) and DC (G4; blue). White dotted lines represent RMS boundaries. Orthogonal reconstructions of confocal sections in the z-axes at the level indicated by the yellow lines are shown in F1, F5, G1, and G5. The individual cells selected for multi-marker illustration are indicated at the intersections of the yellow lines. Scale bars: A, 300 μm; B-G, 50 μm.