
Figure 2.
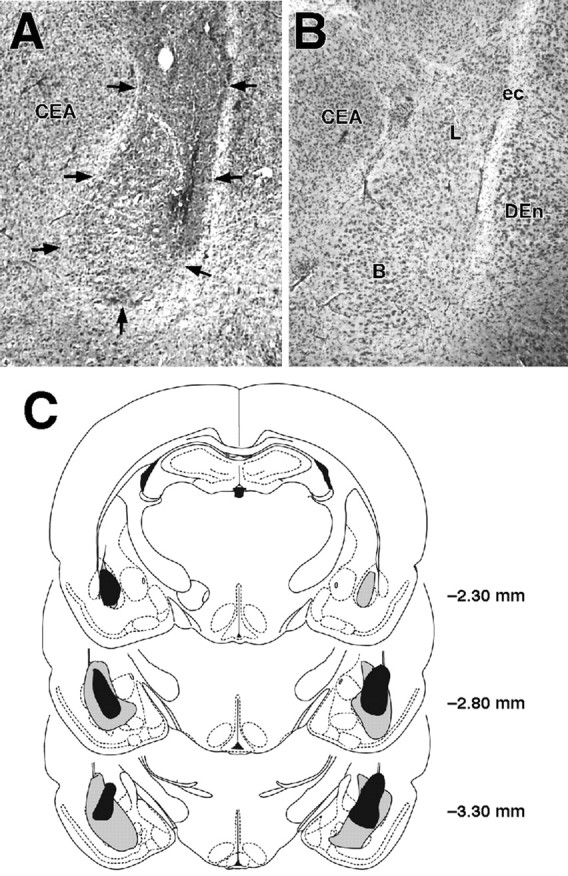
Lesions of the BLA. A, Representative NMDA-induced lesion of the BLA. Arrows denote lesion borders. B, Sham BLA lesion. C, Smallest (black area) and largest (gray area) lesions from rats used in the experiment. Adapted from Paxinos and Watson (1997). B, Basal nuclei; CEA, central amygdala; DEn, dorsal endopiriform nucleus; ec, external capsula; L, lateral nuclei.