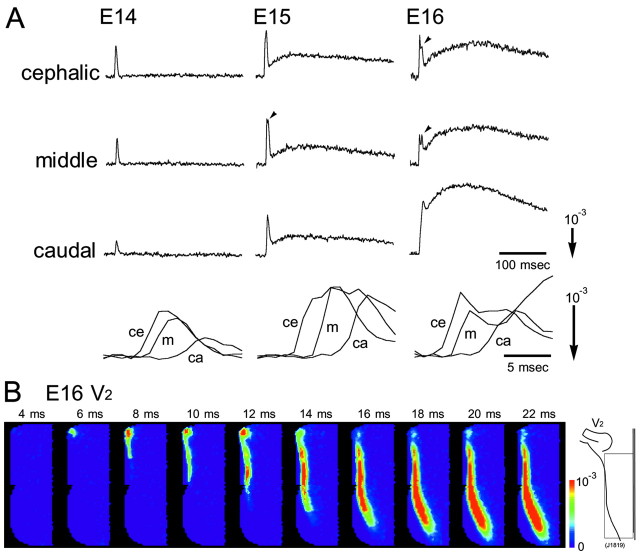
Figure 2.
Enlarged traces and color images of the optical signal. A, Top, Enlarged traces of the optical signals detected from three positions (cephalic, middle, and caudal regions) indicated by asterisks in Figure 1. Arrowheads show the second spike-like signal. Bottom, Expanded time base of the fast component. Signals detected from the three positions (ce, cephalic; m, middle; ca, caudal) are superimposed. The stimulation was applied 3 msec before the onset of the signal. B, Time-lapse imaging representations of the neural response evoked by maxillary (V2) nerve stimulation in an E16 preparation. Color images were constructed from optical signals detected from the area indicated by the square in the right inset using Neuroplex software (RedShirtImaging, Fairfield, CT). The numerals show the time after stimulation.

