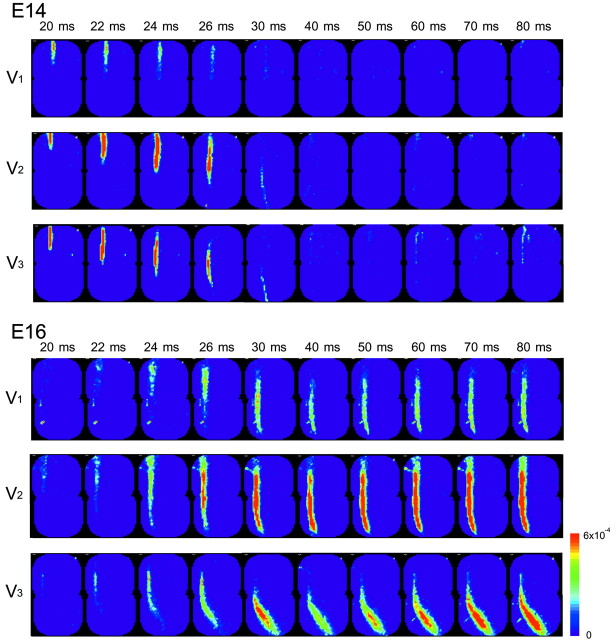
Figure 5.
Spatiotemporal activity maps of V1-V3 responses. Time-lapse imaging representations of the neural responses in E14 (top) and E16 (bottom) preparations are shown. V1, V2, and V3 correspond to the images in response to ophthalmic, maxillary, and mandibular nerve stimulation, respectively. Color images were constructed from optical signals detected from the area indicated by the large squares in the insets of Figure 4.

